Why App Store Connect downloads don't match your Sales report
App Units, First-Time Downloads and Total Downloads count different things. Here's what each one measures, the six reasons Apple gives for the gap, and a 5-step way to make your numbers line up.
 By Alexander, maker of Storewatch · · 9 min read
A few weeks after launching one of my apps, I opened App Store Connect and saw two different answers to the simplest question I could ask. Sales and Trends said the app had 38 units that day. App Analytics said 32 first-time downloads. Same app, same day, same Apple.
Neither number was wrong. They come from two different reporting systems that count different events, at different times, sometimes in different time zones. Once you know what each one measures, the gap stops being mysterious, and you can decide which number to trust for what.
This guide explains exactly why App Store Connect downloads don't match your Sales report, using Apple's own documentation, and ends with a five-step checklist to make the numbers line up.
The short answer
App Store Connect has two separate tools that both look like they count downloads:
- Sales and Trends records transactions. Its default “Units” number counts the moment someone taps Get or Buy, and it also counts in-app purchases and bundles.
- App Analytics records App Store engagement. Its “First-Time Downloads” and “Total Downloads” count installs of the app itself, apply privacy thresholds, and leave out some kinds of downloads.
| Metric | Where | What it counts | What it leaves out |
|---|---|---|---|
| Units (default) | Sales and Trends | First-time app purchases and Gets, plus in-app purchases and bundles | Updates and redownloads, unless you filter for them |
| First-Time Downloads | App Analytics | The first download of the app by an account | watchOS; days below Apple's privacy threshold |
| Redownloads | App Analytics | Downloads started with the redownload button | Automatic updates and device restores |
| Total Downloads | App Analytics | First-Time Downloads plus Redownloads | Everything the two above leave out |
If your app has any in-app purchases, the default Units number will almost always be higher than First-Time Downloads, because it adds purchases on top of downloads. That alone explains most of the confusion I see in developer forums.
Two reports, two data pipelines
Apple describes the tools separately in its overview of reporting tools. Sales and Trends is next-day data, recorded when a customer initiates a transaction. App Analytics is built from App Store data about how people find and download your app, and its usage metrics (sessions, active devices, crashes, deletions) come only from people who agreed to share diagnostics with developers.
There's a third system too: Payments and Financial Reports, which covers settled transactions on Apple's fiscal calendar. That's the number your bank account follows, and it will differ from both of the others. If you're reconciling money, compare financial reports with financial reports.
What each metric actually counts
App Units (Sales and Trends)
According to Apple's page on units, proceeds and sales, an app unit is a first-time purchase or Get, counted when the customer taps Buy or Get. Installing the same app on another device under the same Apple Account, redownloading it, or updating it does not create a new unit. By default, the Units chart also includes in-app purchases and bundles, which is why it's often the highest number on the page.
A few details matter when you compare:
- Family Sharing downloads count as units for free apps, but not for paid apps.
- Refunds show up as negative units.
- Restored in-app purchases are not counted.
- The dashboard shows near-real-time estimates, while downloaded reports are finalized. Apple specifically advises against comparing the two directly.
First-Time Downloads (App Analytics)
Apple's app metrics reference defines First-Time Downloads as the first download of your app on iOS, macOS, tvOS or visionOS. This is the closest equivalent to “new users from the App Store”, and it's the number I watch day to day.
Redownloads and restores
App Analytics counts a redownload when someone taps the redownload (cloud) button. It does not count automatic updates or downloads that happen when someone restores a device from a backup. Sales and Trends does include restores when you filter for redownloads. That's why developers regularly see redownload numbers that are wildly different between the two tools, sometimes several times higher in Sales and Trends.
Updates
Updates are counted on every device that installs them. If you have a loyal audience and ship often, updates can easily outnumber new downloads. That's normal, and it's not a sign of anything wrong.
Six reasons Apple gives for the difference
Apple keeps a short page called differences in reporting tools. It lists these reasons the totals won't match:
- Time zones. App Analytics uses UTC. Sales and Trends defaults to UTC but can be switched to Pacific time, and downloaded sales reports use Pacific time (a day runs from midnight to 11:59 pm PT).
- Restores. App Analytics leaves restores out of redownloads; Sales and Trends includes them.
- TestFlight. App Analytics excludes sales metrics from TestFlight builds; Sales and Trends includes them.
- watchOS. App Analytics doesn't include watchOS sales or redownloads.
- Apps removed from sale. App Analytics leaves out in-app purchase transactions, like subscription renewals, for apps that were removed from sale; Sales and Trends keeps them.
- Processing time. Some transactions are recorded on different dates in the two systems because they're processed at different times.
Privacy thresholds and opt-in
App Analytics protects user privacy, and that shapes the numbers in two ways. First, metrics only appear once there's enough data: Apple's metrics reference says download metrics need at least five first-time downloads, and usage metrics need at least five active devices. On a quiet day for a small app, you may see a gap or a zero where Sales and Trends shows a few units.
Second, usage metrics (installations, sessions, active devices, crashes) only come from people who opted in to share their data with developers. Download counts are based on App Store data, so they're less affected, but anything about usage represents a sample, not everyone.
If you use the App Store Connect Analytics Reports API, Apple's downloads report documentation adds two more rules: rows with fewer than five users or devices are left out, and a small amount of statistical noise is added to protect privacy. Expect small differences from the website even when you're comparing the “same” number.
When the numbers become final
Timing explains a lot of day-to-day frustration:
- Sales and Trends is next-day data. Hourly data for the last 24 hours usually appears within about two hours, but it's an estimate until the daily report is final.
- App Analytics reports via the API: Apple says data for a given day is considered complete two days after the reporting date, and later batches can add late events or corrections.
- Financial reports come later still, on Apple's fiscal calendar.
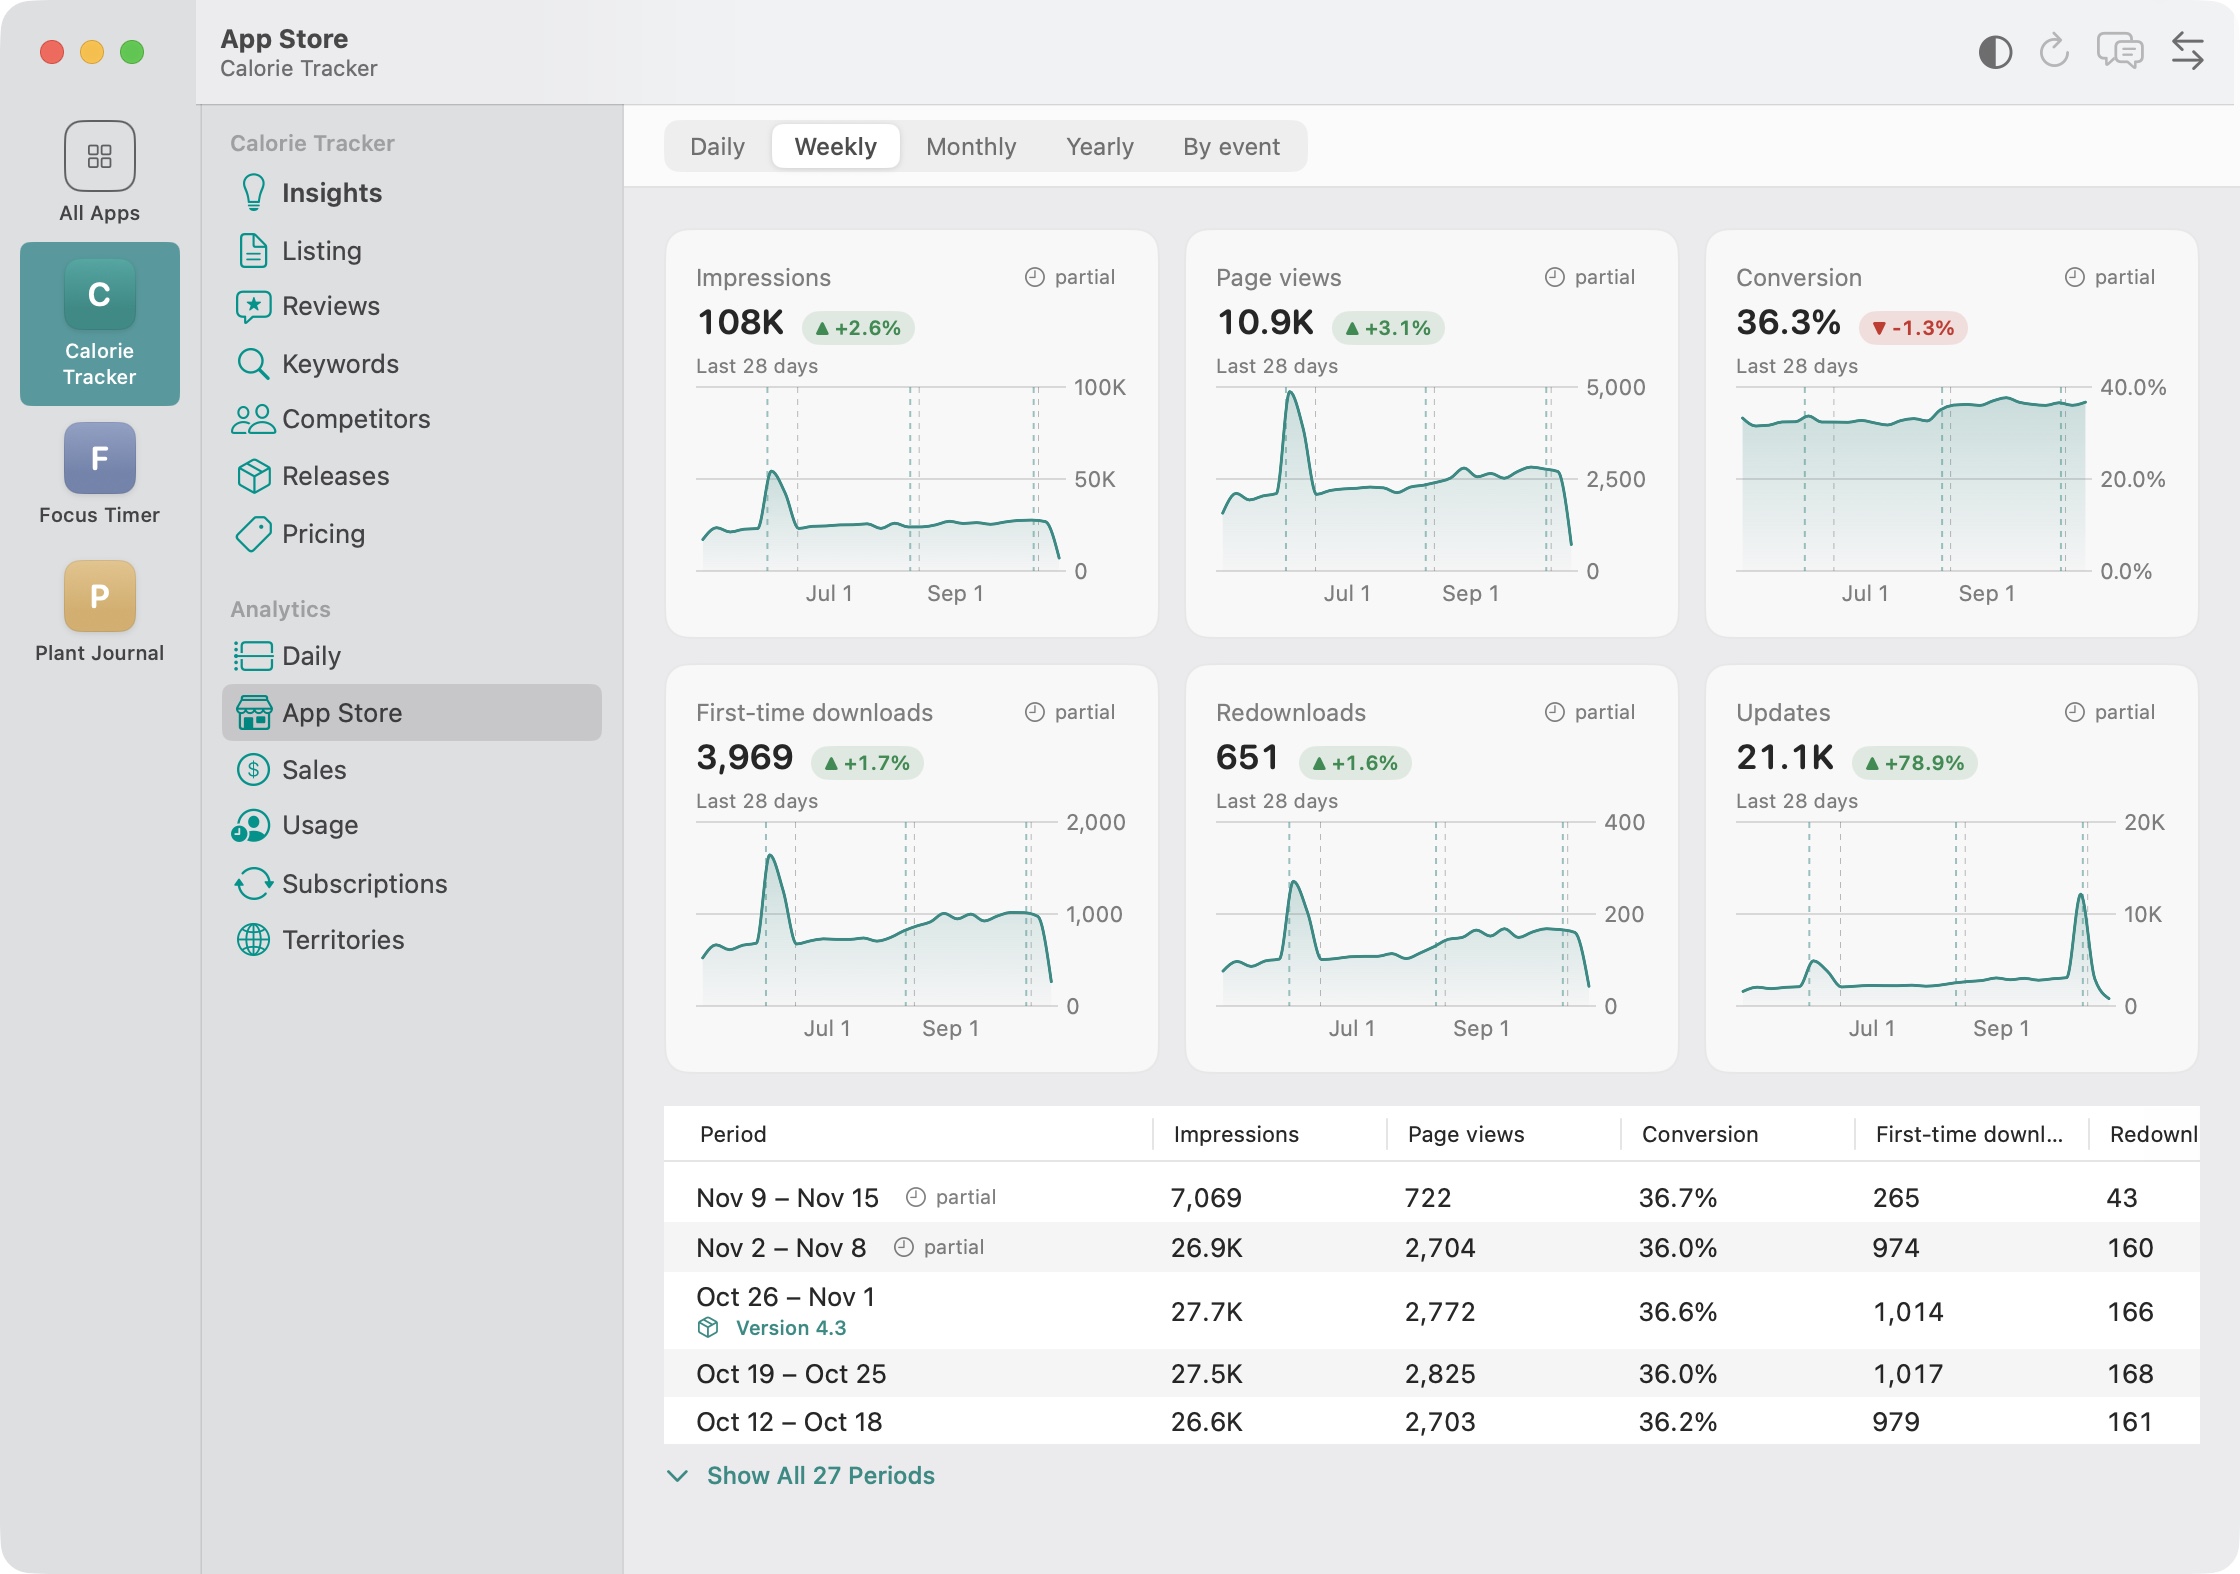
In practice, I treat the last two or three days as provisional. In Storewatch, I mark those days as “partial” or “preliminary” for exactly this reason, so I don't panic about a number that will grow tomorrow.
Which API number to compare with which
If you pull data yourself, match the API to the screen you're comparing against:
- The Sales Reports endpoint lines up with Sales and Trends. Product type 1 rows are app units; updates have their own product type. Remember the Pacific-time days in downloaded reports.
- The Analytics Reports API lines up with App Analytics. Its download report includes a download type (first-time, redownload, manual update, auto-update, restore), so you can rebuild App Analytics' definitions by filtering, for example by excluding restores and updates.
Apple's guide to downloading App Analytics reports explains the setup: an Admin has to make the first report request, the first ongoing report usually arrives within 24 to 48 hours, and a one-time snapshot can fill in history.
A 5-step checklist to make the numbers line up
- Use the same date range and the same time zone. Set Sales and Trends to UTC to match App Analytics, or compare whole weeks so a day's shift doesn't matter.
- Filter Units down to app downloads. In Sales and Trends, filter by content type so in-app purchases and bundles drop out.
- Compare Units with First-Time Downloads, not Total Downloads. Redownloads are defined differently in each tool.
- Leave out the newest days. Compare days that are at least two or three days old, when both systems have settled.
- Account for what one side excludes: TestFlight, watchOS, restores, and days below the privacy threshold.
After these steps, the numbers usually get much closer, though they rarely match to the unit. My own 38 vs 32 was a textbook case: I was comparing a sales-report count with App Analytics' First-Time Downloads for a day that was barely a day old. Different systems, different definitions, and one of them still filling in.
When a gap is normal, and when to look closer
Small, steady differences are normal. Look closer if:
- The gap suddenly grows after a release. Check whether a lot of restores or redownloads are being counted on one side.
- App Analytics shows zero for days when Sales and Trends shows downloads. You may be below the privacy threshold, or analytics data may not have arrived yet.
- Your financial reports don't match either. That's expected (settled vs initiated transactions), but large differences are worth asking Apple about.
Frequently asked questions
Which number is my real download count?
For new users, use First-Time Downloads in App Analytics. It counts first installs of the app itself and leaves out in-app purchases, updates and restores. Use Sales and Trends Units when you care about transactions, including purchases.
Why are my Units higher than my Total Downloads?
By default, Units in Sales and Trends includes in-app purchases and bundles, and free apps also count Family Sharing downloads. Filter Units to app downloads only and the gap usually shrinks.
Why do redownloads differ so much between the two reports?
Sales and Trends includes device restores in redownloads; App Analytics doesn't. When many people restore a new iPhone from a backup, Sales and Trends can show far more redownloads.
Is Sales and Trends in UTC or Pacific time?
Apple says Sales and Trends defaults to UTC and can be switched to Pacific time, while downloaded sales reports use Pacific time days. App Analytics always uses UTC.
When is App Store Connect data final?
Sales and Trends is next-day data. Apple says analytics data for a day is complete two days after that day, and later corrections can still arrive. Treat the most recent two or three days as provisional.
Do the numbers include TestFlight or Apple Watch?
Sales and Trends includes TestFlight-related sales metrics and watchOS; App Analytics excludes both, according to Apple's differences page.
How I keep an eye on this now
I built Storewatch because I was checking three apps in two reports every morning. It pulls both the sales reports and the analytics reports with your own App Store Connect API key, keeps everything on your Mac, and labels each number with where it came from. Days that are still settling are marked “preliminary”, with a short explanation of why App Store Connect might show something different. If you also wonder how to see all your apps together, I wrote about tracking analytics for several iOS apps in one place.