How to track analytics for all your iOS apps in one place
App Store Connect shows one app at a time. Here are the five ways indie developers combine downloads, proceeds, reviews and keywords across several apps, with the trade-offs of each and a 15-minute weekly routine.
 By Alexander, maker of Storewatch · · 7 min read
When I had one app, App Store Connect was fine. With three, my mornings looked like this: open App Store Connect, pick app one, check downloads. Back, pick app two. Back, app three. Then Sales and Trends for proceeds, then each app's Ratings and Reviews page, then a spreadsheet for keyword ranks. Twenty minutes, every day, to answer “how did my apps do yesterday?”
If you ship more than one app, you've probably felt the same thing. This guide covers what App Store Connect can and can't show for a portfolio, the five realistic ways to get everything in one place, and the short weekly routine I use now.
What “one place” actually needs to include
Before picking a tool, it helps to be clear about what you want to see. For most indie developers with several apps, it's these, for every app side by side and as a total:
- Downloads: first-time downloads per day, by country and source.
- Money: proceeds in your own currency, plus active subscriptions if you sell them.
- Funnel: impressions, product page views and conversion rate.
- Reviews and ratings: new reviews from every country, especially the low ones you should answer.
- Keyword ranks for the searches you care about.
- Listing health: wasted keyword space, missing translations, a version waiting for review.
- Stability: crash rate after each release.
Not everyone needs all of it, but it's worth deciding up front, because tools differ a lot in which of these they cover.
What App Store Connect gives you, and where it stops
App Store Connect is the source of truth, and everything else on this list ultimately reads from it. According to Apple's overview of reporting tools, there are three main places to look:
Sales and Trends
Sales and Trends works at the account level, so you can see units and proceeds for all your apps and filter by app. It's next-day data, recorded when a customer taps Get or Buy. It's the closest App Store Connect comes to a portfolio view, but it doesn't include analytics like impressions or conversion.
App Analytics
App Analytics has the richer metrics: impressions, product page views, conversion rate, first-time downloads, sources, retention and crashes. But it's built around one app at a time. Comparing three apps means three trips through the same screens.
Ratings and Reviews
Reviews also live per app, and per country. Replying is easy once you find a review; finding the new ones across several apps and dozens of countries is the slow part.
Option 1: Build your own with the App Store Connect API
Apple lets you automate both reports. The Sales Reports endpoint covers every app under your vendor number in one request, and the Analytics Reports API gives detailed daily data per app once an Admin has requested it.
Good for: developers who enjoy building internal tools and want full control.
What to watch out for:
- API keys use JSON Web Tokens you sign yourself, and the first analytics request must be made by an Admin.
- The first analytics report takes a day or two to arrive, and Apple says each day's data is complete only two days later.
- Sales reports use Pacific-time days while analytics use UTC, so the numbers don't line up by default.
- Privacy thresholding hides small numbers, and you'll need to store history yourself.
It's very doable, but it's a project, not an afternoon. I know, because it's how Storewatch started.
Option 2: Spreadsheets and exports
Download reports from Sales and Trends and App Analytics, paste them into a spreadsheet, and build a summary tab. It's free and flexible.
The catch: it's manual, it breaks whenever Apple changes a column, and you'll stop doing it the week you get busy, which is exactly when you most need the numbers.
Option 3: Your subscription platform
If you sell subscriptions through a platform like RevenueCat, its dashboard already shows revenue, trials, conversions and churn, and according to RevenueCat's community answers, an account-level overview can combine several projects.
The catch: it only knows about purchases made through its SDK. It doesn't see App Store downloads, impressions, conversion, reviews or keyword ranks, and paid-upfront apps without subscriptions don't appear at all. It's a great revenue tool, not a full portfolio view.
Option 4: Web-based app intelligence tools
Services like Appfigures, AppTweak, AppFollow and Sensor Tower connect to your App Store Connect account and show your apps together, often alongside competitor and market data. Pricing and focus vary widely:
| Type | Typical strengths | Things to check |
|---|---|---|
| Indie-friendly analytics (e.g. Appfigures) | Downloads, revenue, reviews and ranks across apps; Appfigures lists a free plan for a handful of apps on its pricing page | Per-app pricing as you grow; where your data is stored |
| ASO platforms (e.g. AppTweak) | Keyword research, competitor tracking, metadata suggestions | Monthly cost; how much of it you'd actually use |
| Market intelligence (e.g. Sensor Tower) | Estimates for the whole market, competitor downloads and revenue | Priced for larger companies; more than most indies need |
Good for: people who want competitor and market data, or who work across iOS and Android.
The catch: most are subscriptions, and your App Store Connect key and data live on someone else's servers. That's fine for many teams; some indie developers prefer to keep their numbers local.
Option 5: A native Mac app
This is the lane I ended up building for myself. A native app reads App Store Connect with your own API key and keeps everything on your Mac, so there's no account to create and nothing stored on a vendor's server.
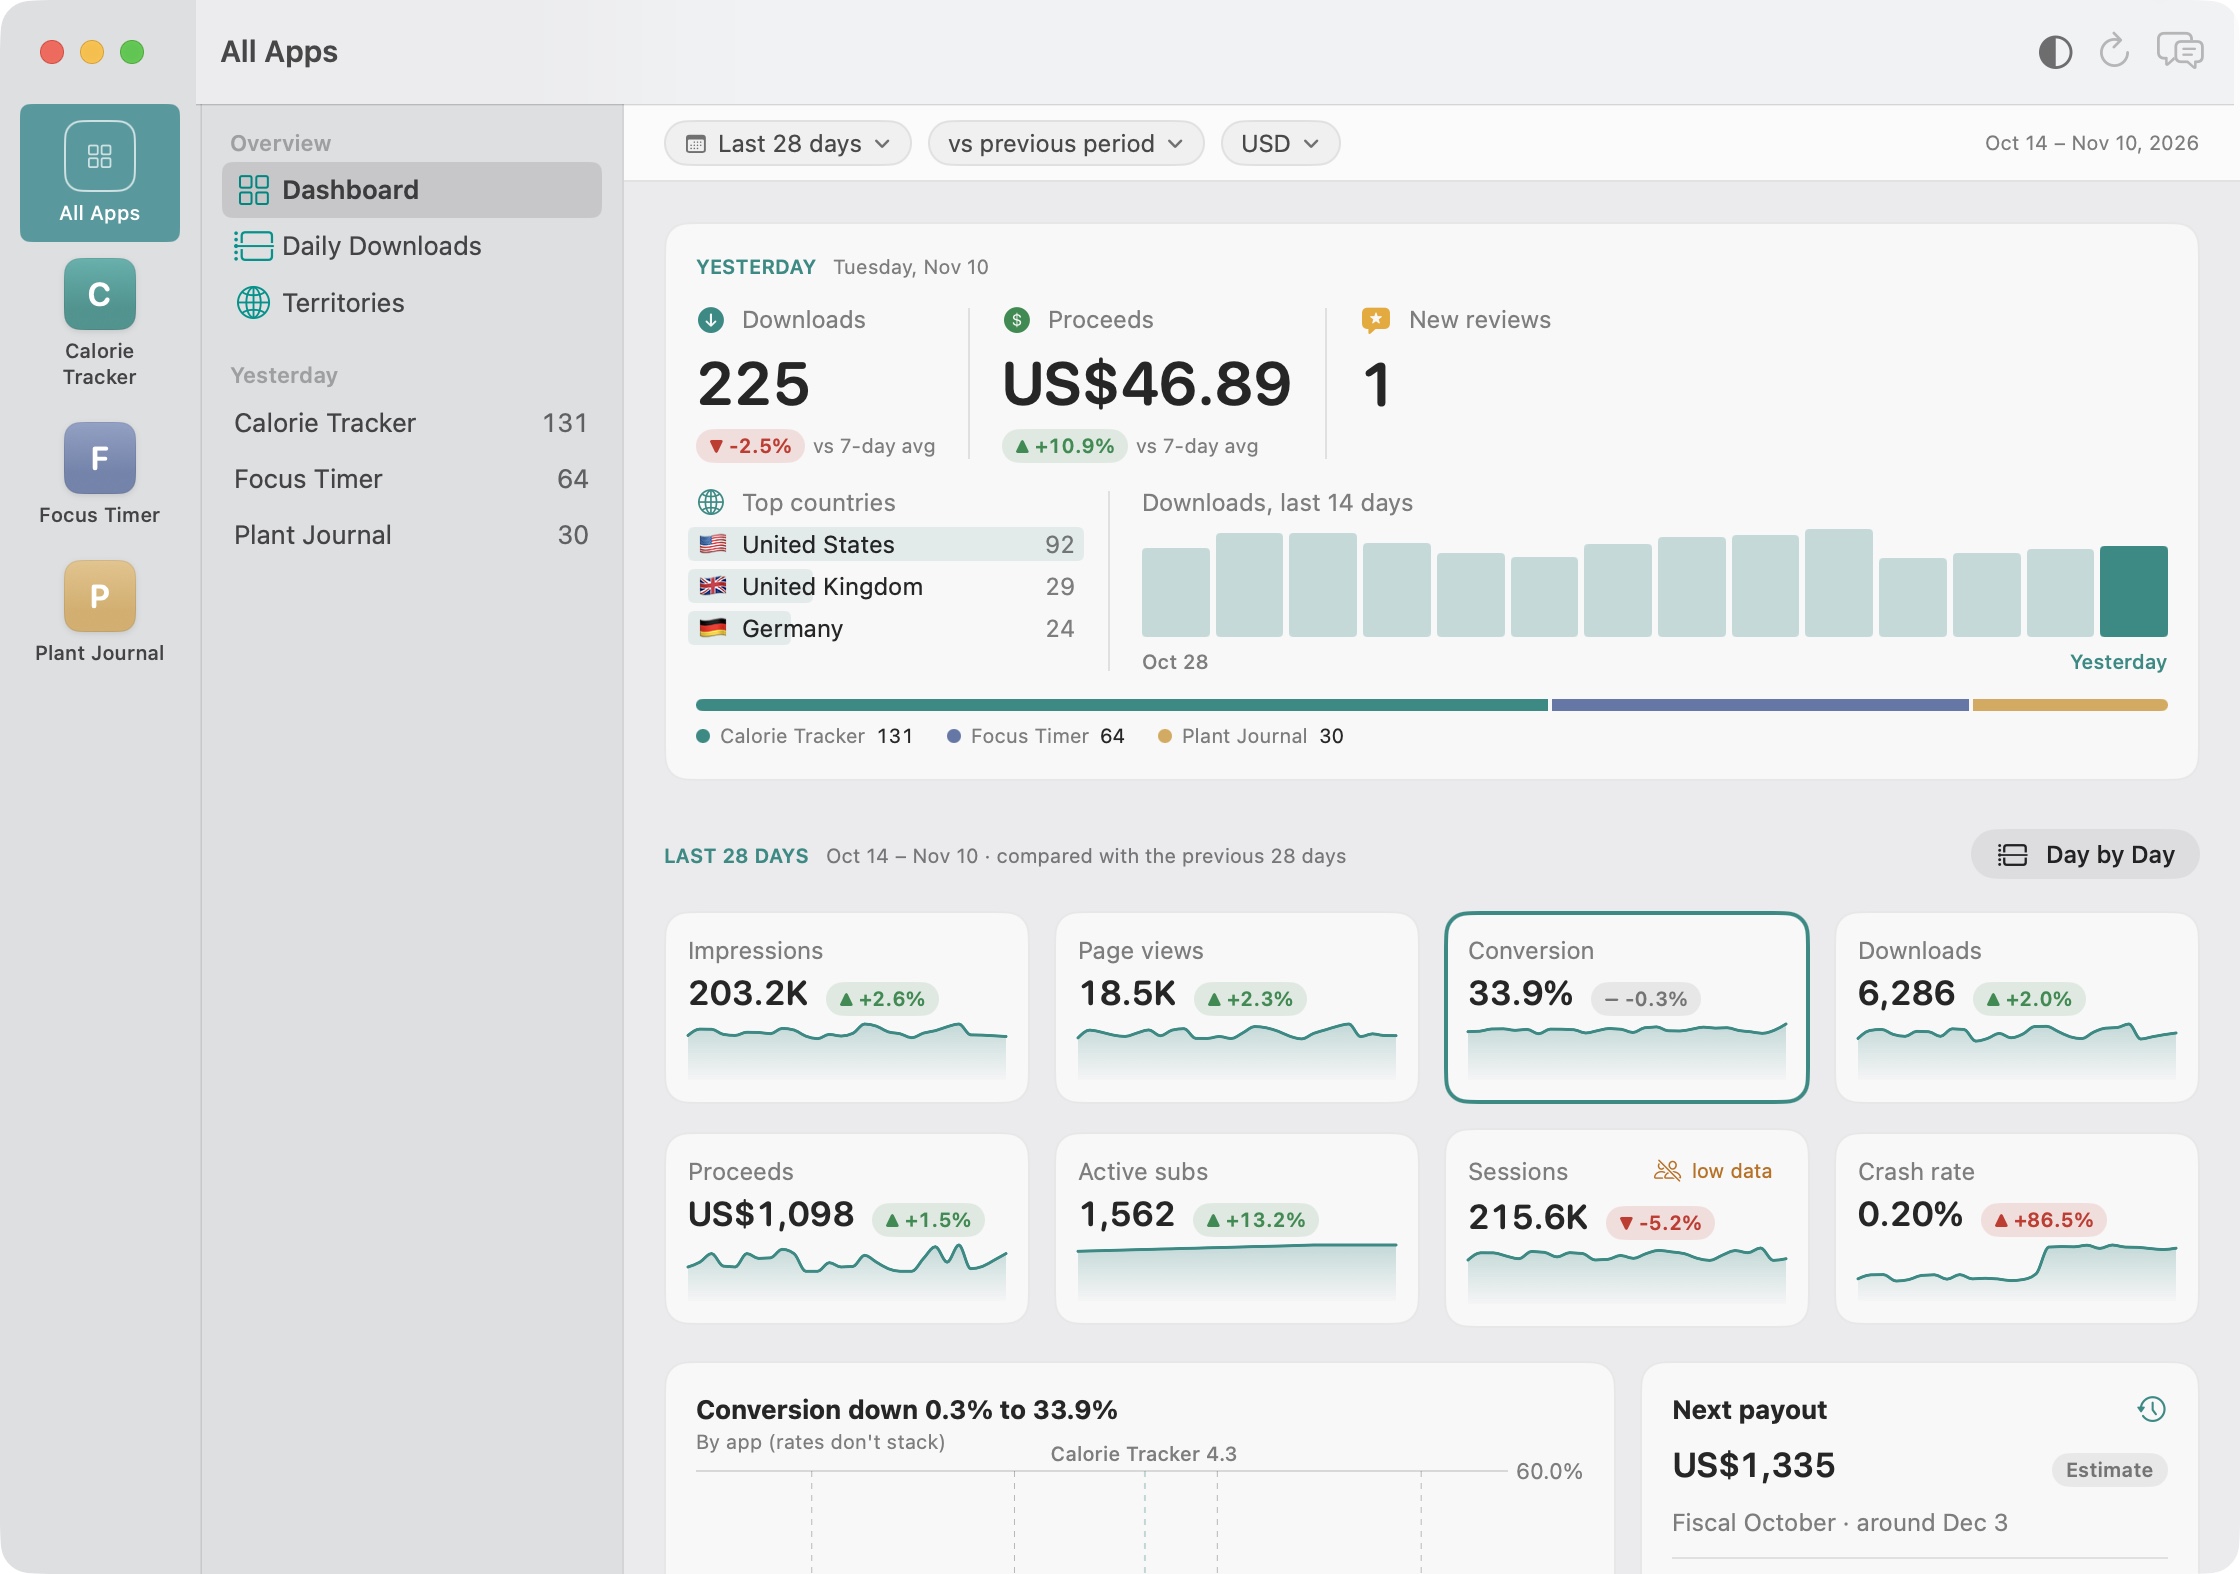
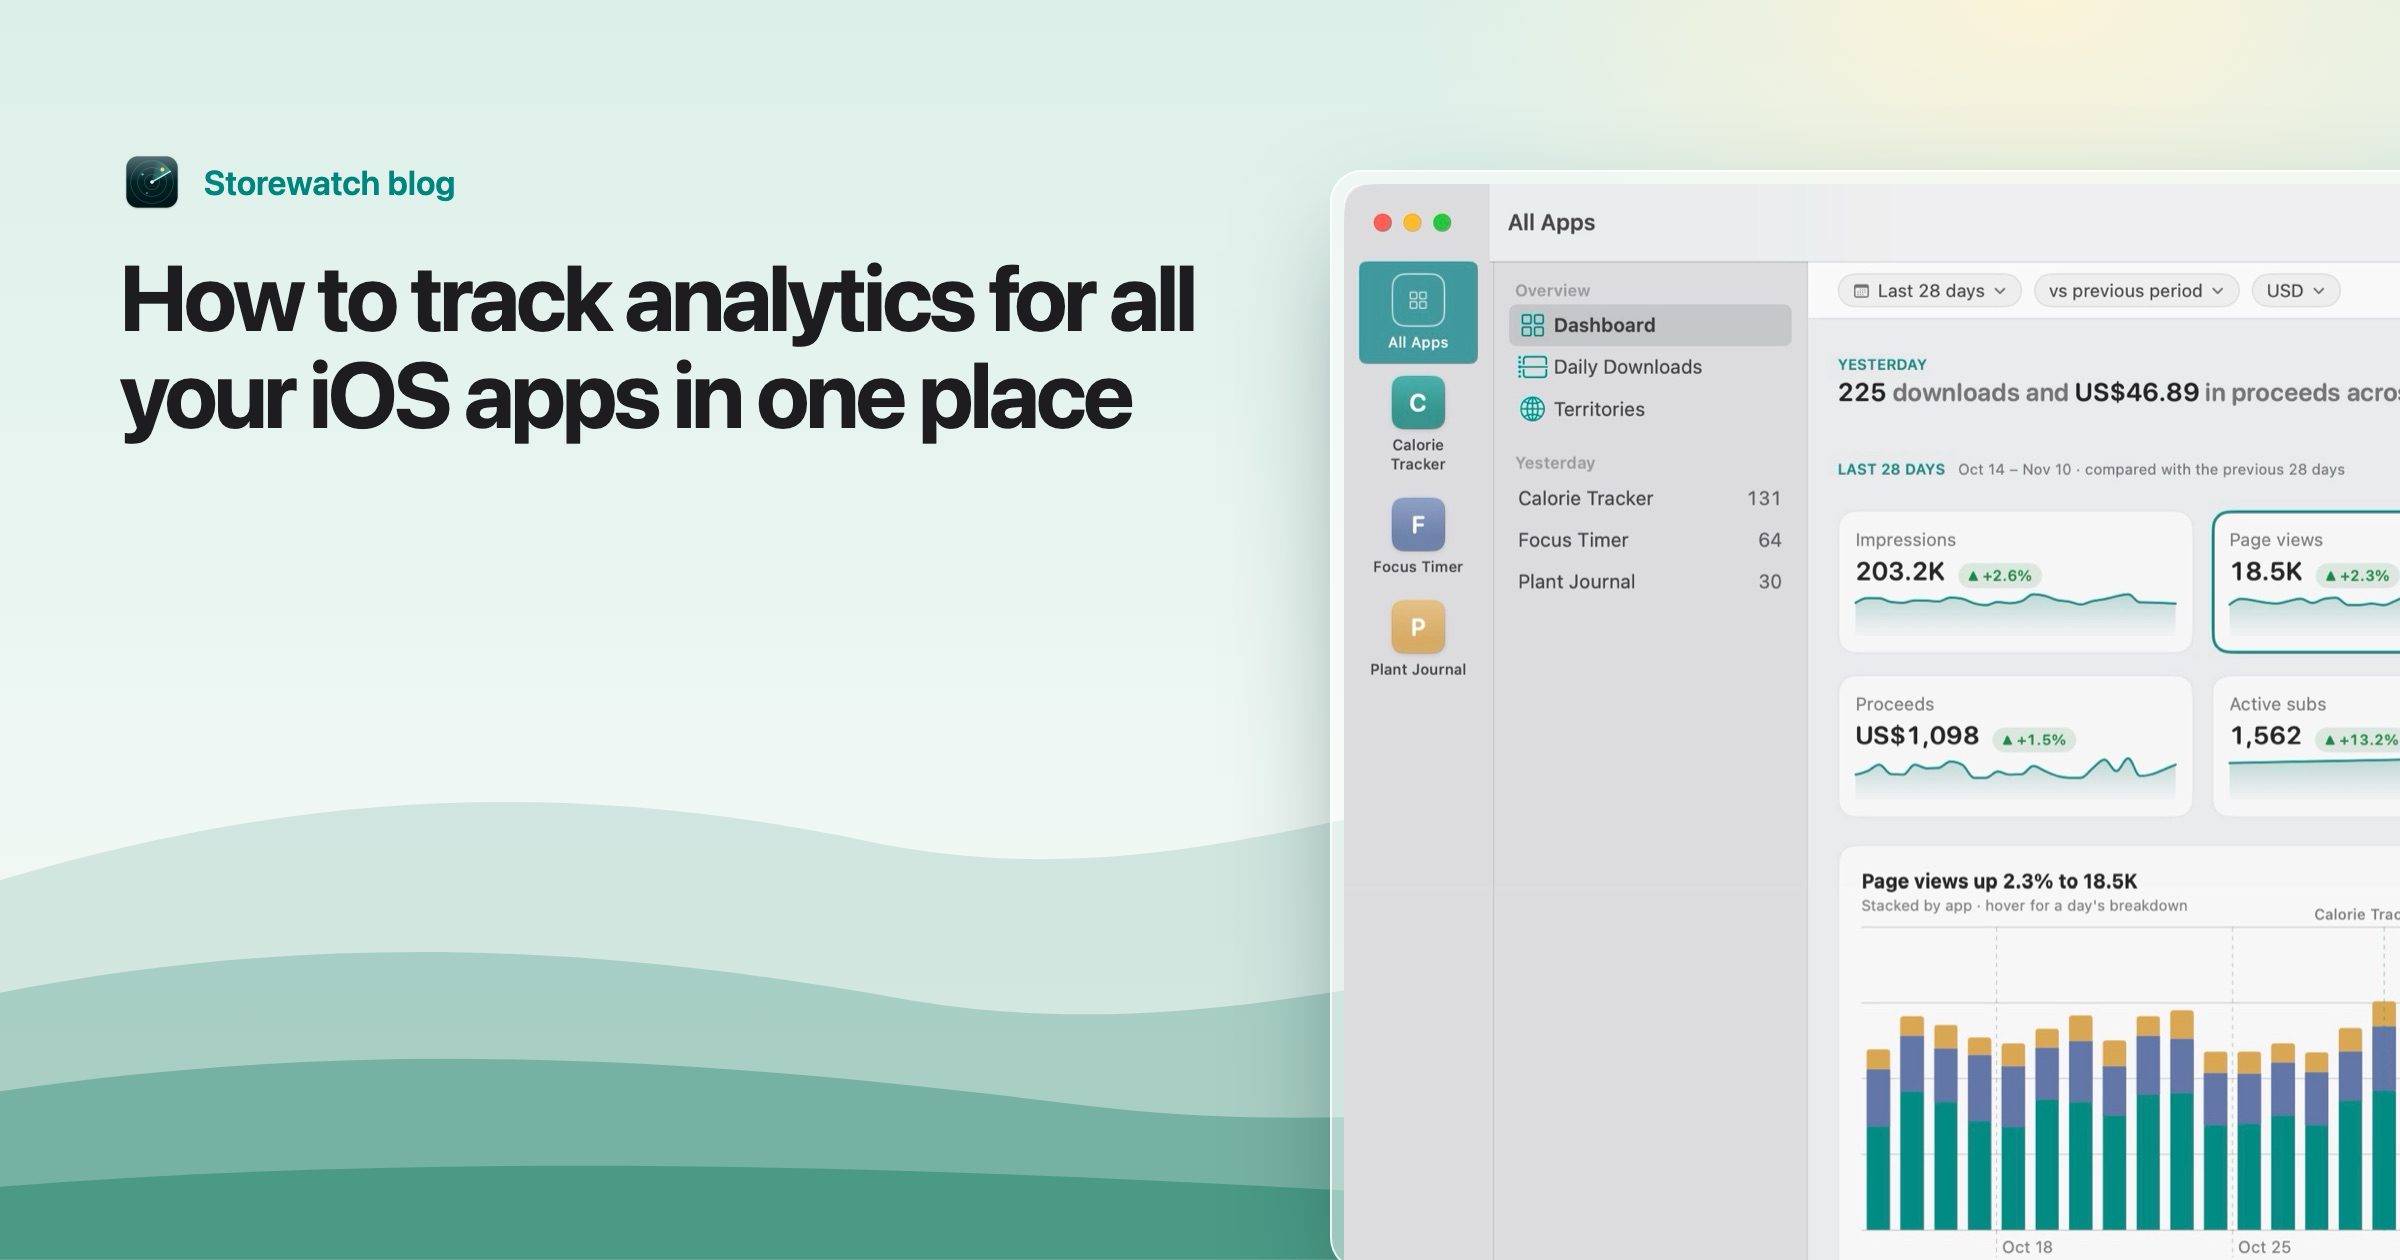
In Storewatch, the All Apps dashboard answers “how did yesterday go?” in one line, then shows downloads, proceeds, impressions, conversion, sessions and crash rate for every app, stacked by app on one chart. Reviews from every app and country land in one inbox. Insights flag things like a short keyword field, untranslated languages or a crash spike after a release, per app or across all of them. It supports several developer accounts, too.
The catch: it's Mac-only, Apple-only, and it doesn't estimate competitors' downloads. If you need Android or market-wide data, a web tool is the better fit.
In-app analytics is a different job
Tools like TelemetryDeck, Firebase or Mixpanel measure what people do inside your app: screens, features, funnels. They're valuable, but they don't replace store analytics. You still need App Store data for impressions, conversion, downloads by source, proceeds and reviews. Most indie developers end up with one of each: a store analytics view and, optionally, a privacy-friendly in-app tool.
How to choose
- Two or three apps, Apple only, tight budget: a native Mac app, or a free plan from a web tool if you're comfortable with the data living there.
- Subscriptions are most of your revenue: your subscription platform for revenue, plus a store analytics tool for downloads, conversion and reviews.
- iOS and Android, or competitor research: a web-based ASO or intelligence platform.
- You love building tools: the App Store Connect API, with plenty of patience for time zones and late data.
A 15-minute weekly routine for several apps
Whatever you use, a fixed routine beats checking numbers whenever you're anxious. Mine, every Monday:
- Portfolio first (3 minutes). Last 7 days vs the previous 7 for downloads and proceeds across all apps. Which app moved?
- Explain the movers (4 minutes). For any app that moved more than 15 to 20 percent, check sources, top countries and whether a release or feature landed.
- Reviews (4 minutes). Reply to every new 1 to 3 star review, in the reviewer's language.
- Listing health (2 minutes). Any app with unused keyword characters, missing translations or a version stuck in review?
- Write one line (2 minutes). What you'll change this week, and in which app. Next Monday, check whether it worked.
Setting up an App Store Connect API key safely
Every option except spreadsheets needs an API key, created in App Store Connect under Users and Access, Integrations. A few habits keep it safe:
- Give the key only the role the tool needs. Reading sales and analytics needs Sales and Reports or Finance access, though Apple requires an Admin for the very first analytics report request.
- The private key file (.p8) can be downloaded only once. Store it in a password manager or the macOS Keychain, never in a shared folder or repository.
- Revoke the key in App Store Connect if you stop using a tool. That immediately cuts off its access.
Frequently asked questions
Can App Store Connect show all my apps in one dashboard?
Partly. Sales and Trends shows units and proceeds for your whole account and can filter by app, but App Analytics metrics like impressions and conversion are shown one app at a time.
What's the cheapest way to track several apps?
Spreadsheets are free but manual. Several tools offer free tiers for a few apps, and a one-time-purchase Mac app avoids ongoing subscription costs.
Do I need Sensor Tower as an indie developer?
Usually not. Market intelligence tools are priced for larger companies and focus on competitor estimates. Most indies get more value from clear first-party data about their own apps.
Is RevenueCat enough to track multiple apps?
For subscription revenue, it's excellent. It doesn't show App Store downloads, impressions, conversion, reviews or keyword ranks, so most developers pair it with a store analytics tool.
Is my API key safe in a third-party tool?
It depends where the tool keeps it. Web tools store keys on their servers; native apps like Storewatch keep them in your Mac's Keychain. Either way, use the least access needed and revoke keys you no longer use.
Why don't third-party totals match App Store Connect?
Usually because they read a different report (sales vs analytics), use a different time zone, or include days that are still being updated. See why the numbers differ.