App Store Connect Analytics Reports API: a practical guide, and the double-counting trap
How to request, list and download App Store Connect analytics reports with the API, step by step, plus the traps that quietly break your numbers: restated days, overlapping requests, quiet days and privacy gaps.
 By Alexander, maker of Storewatch · · 9 min read
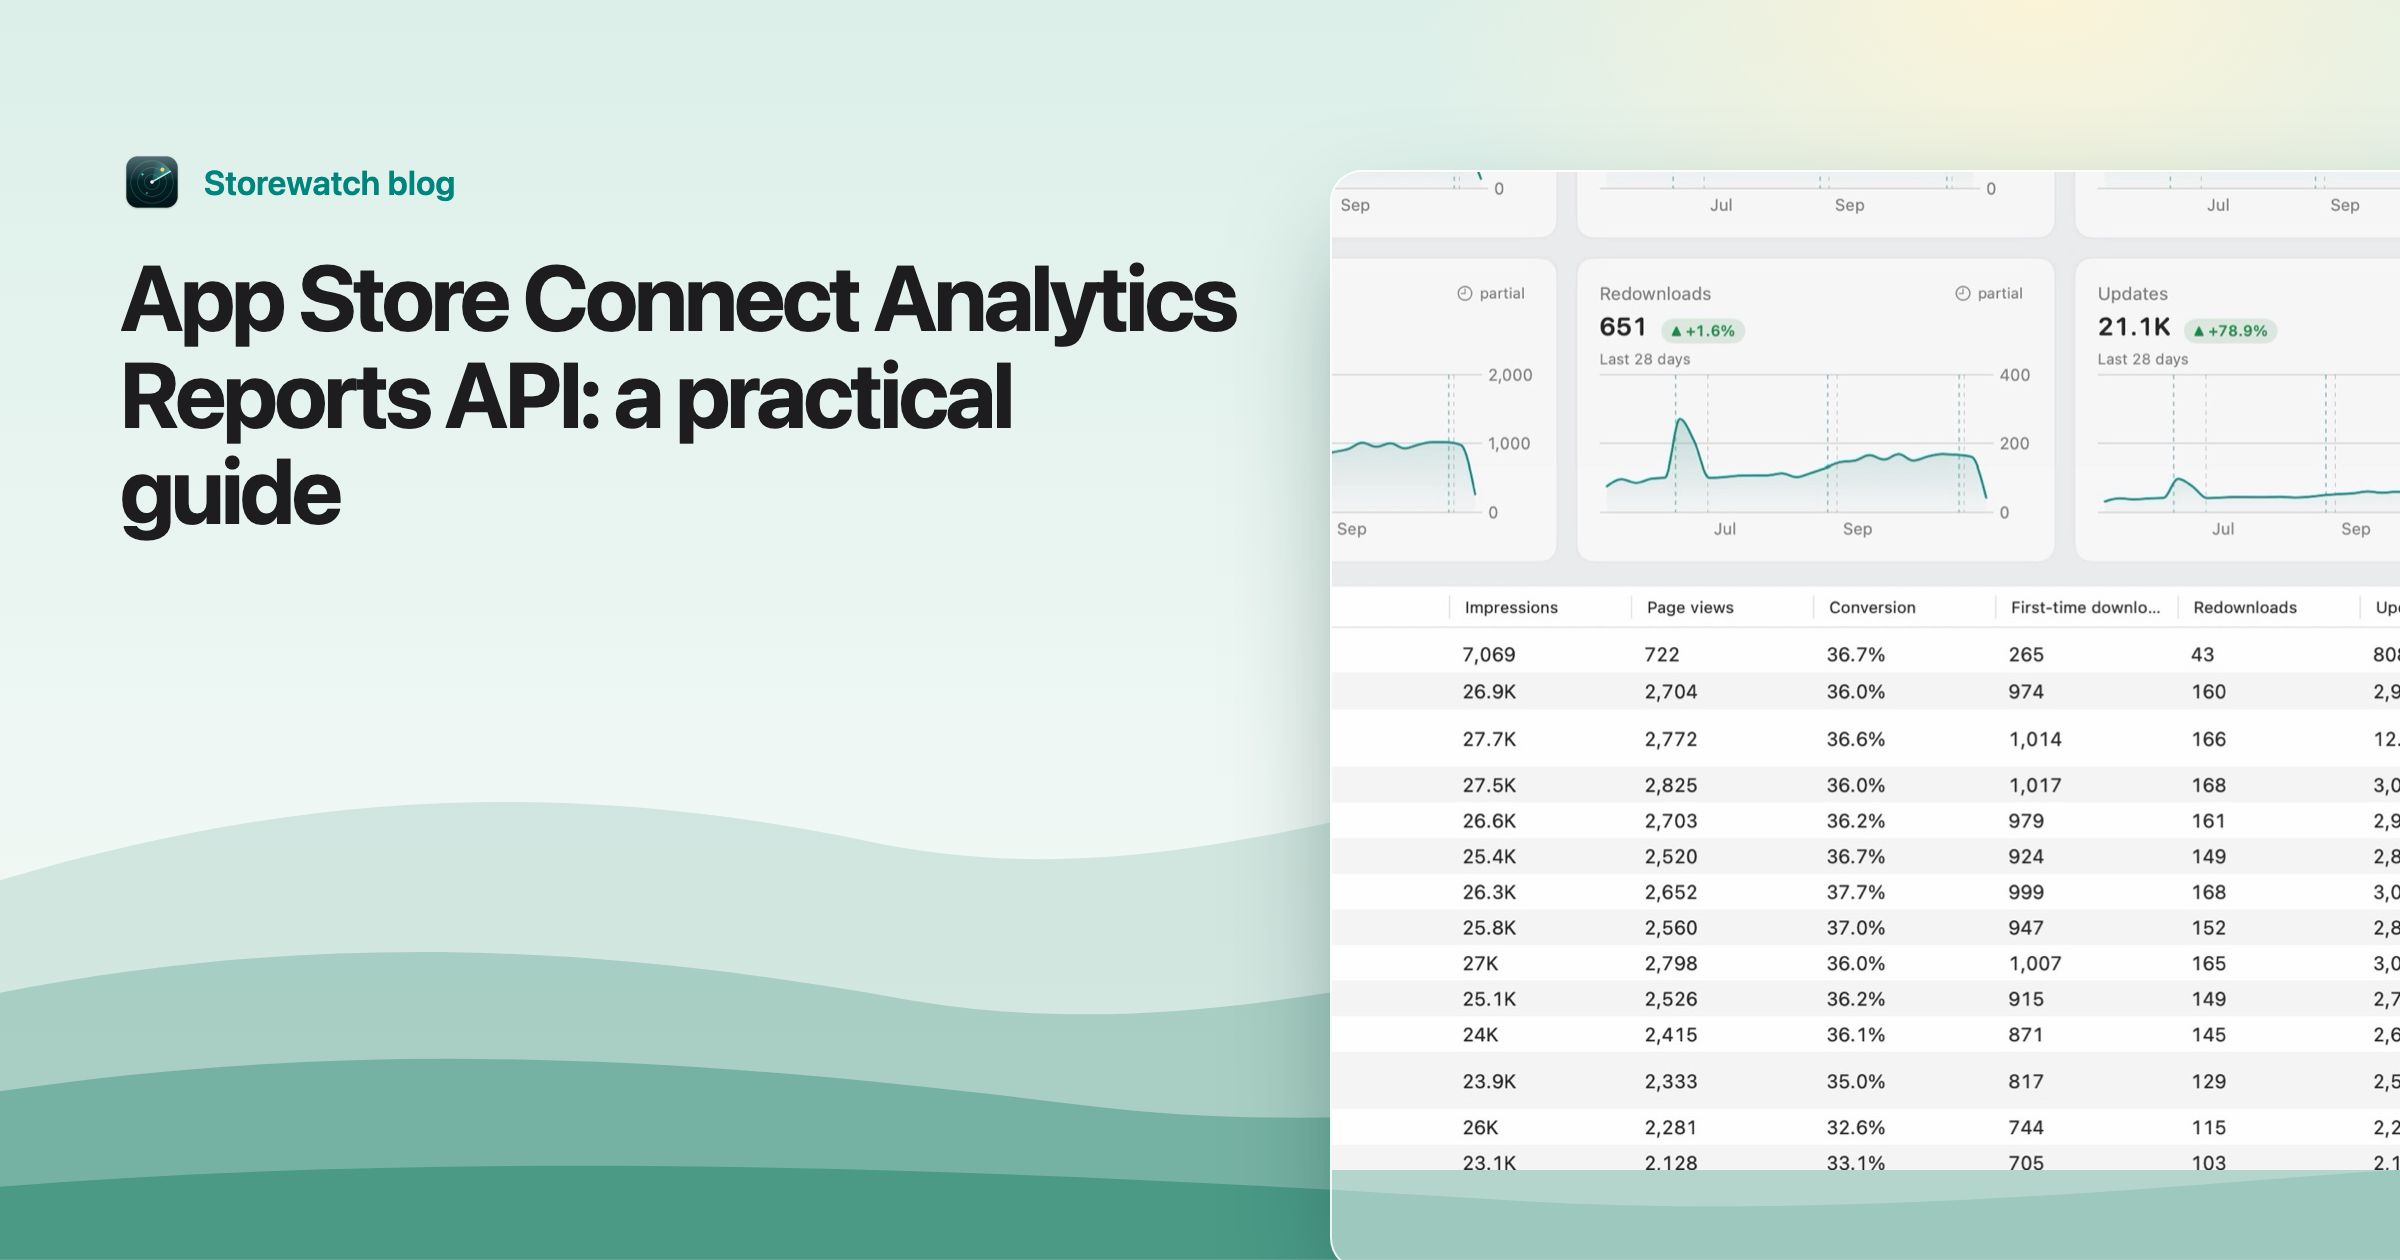
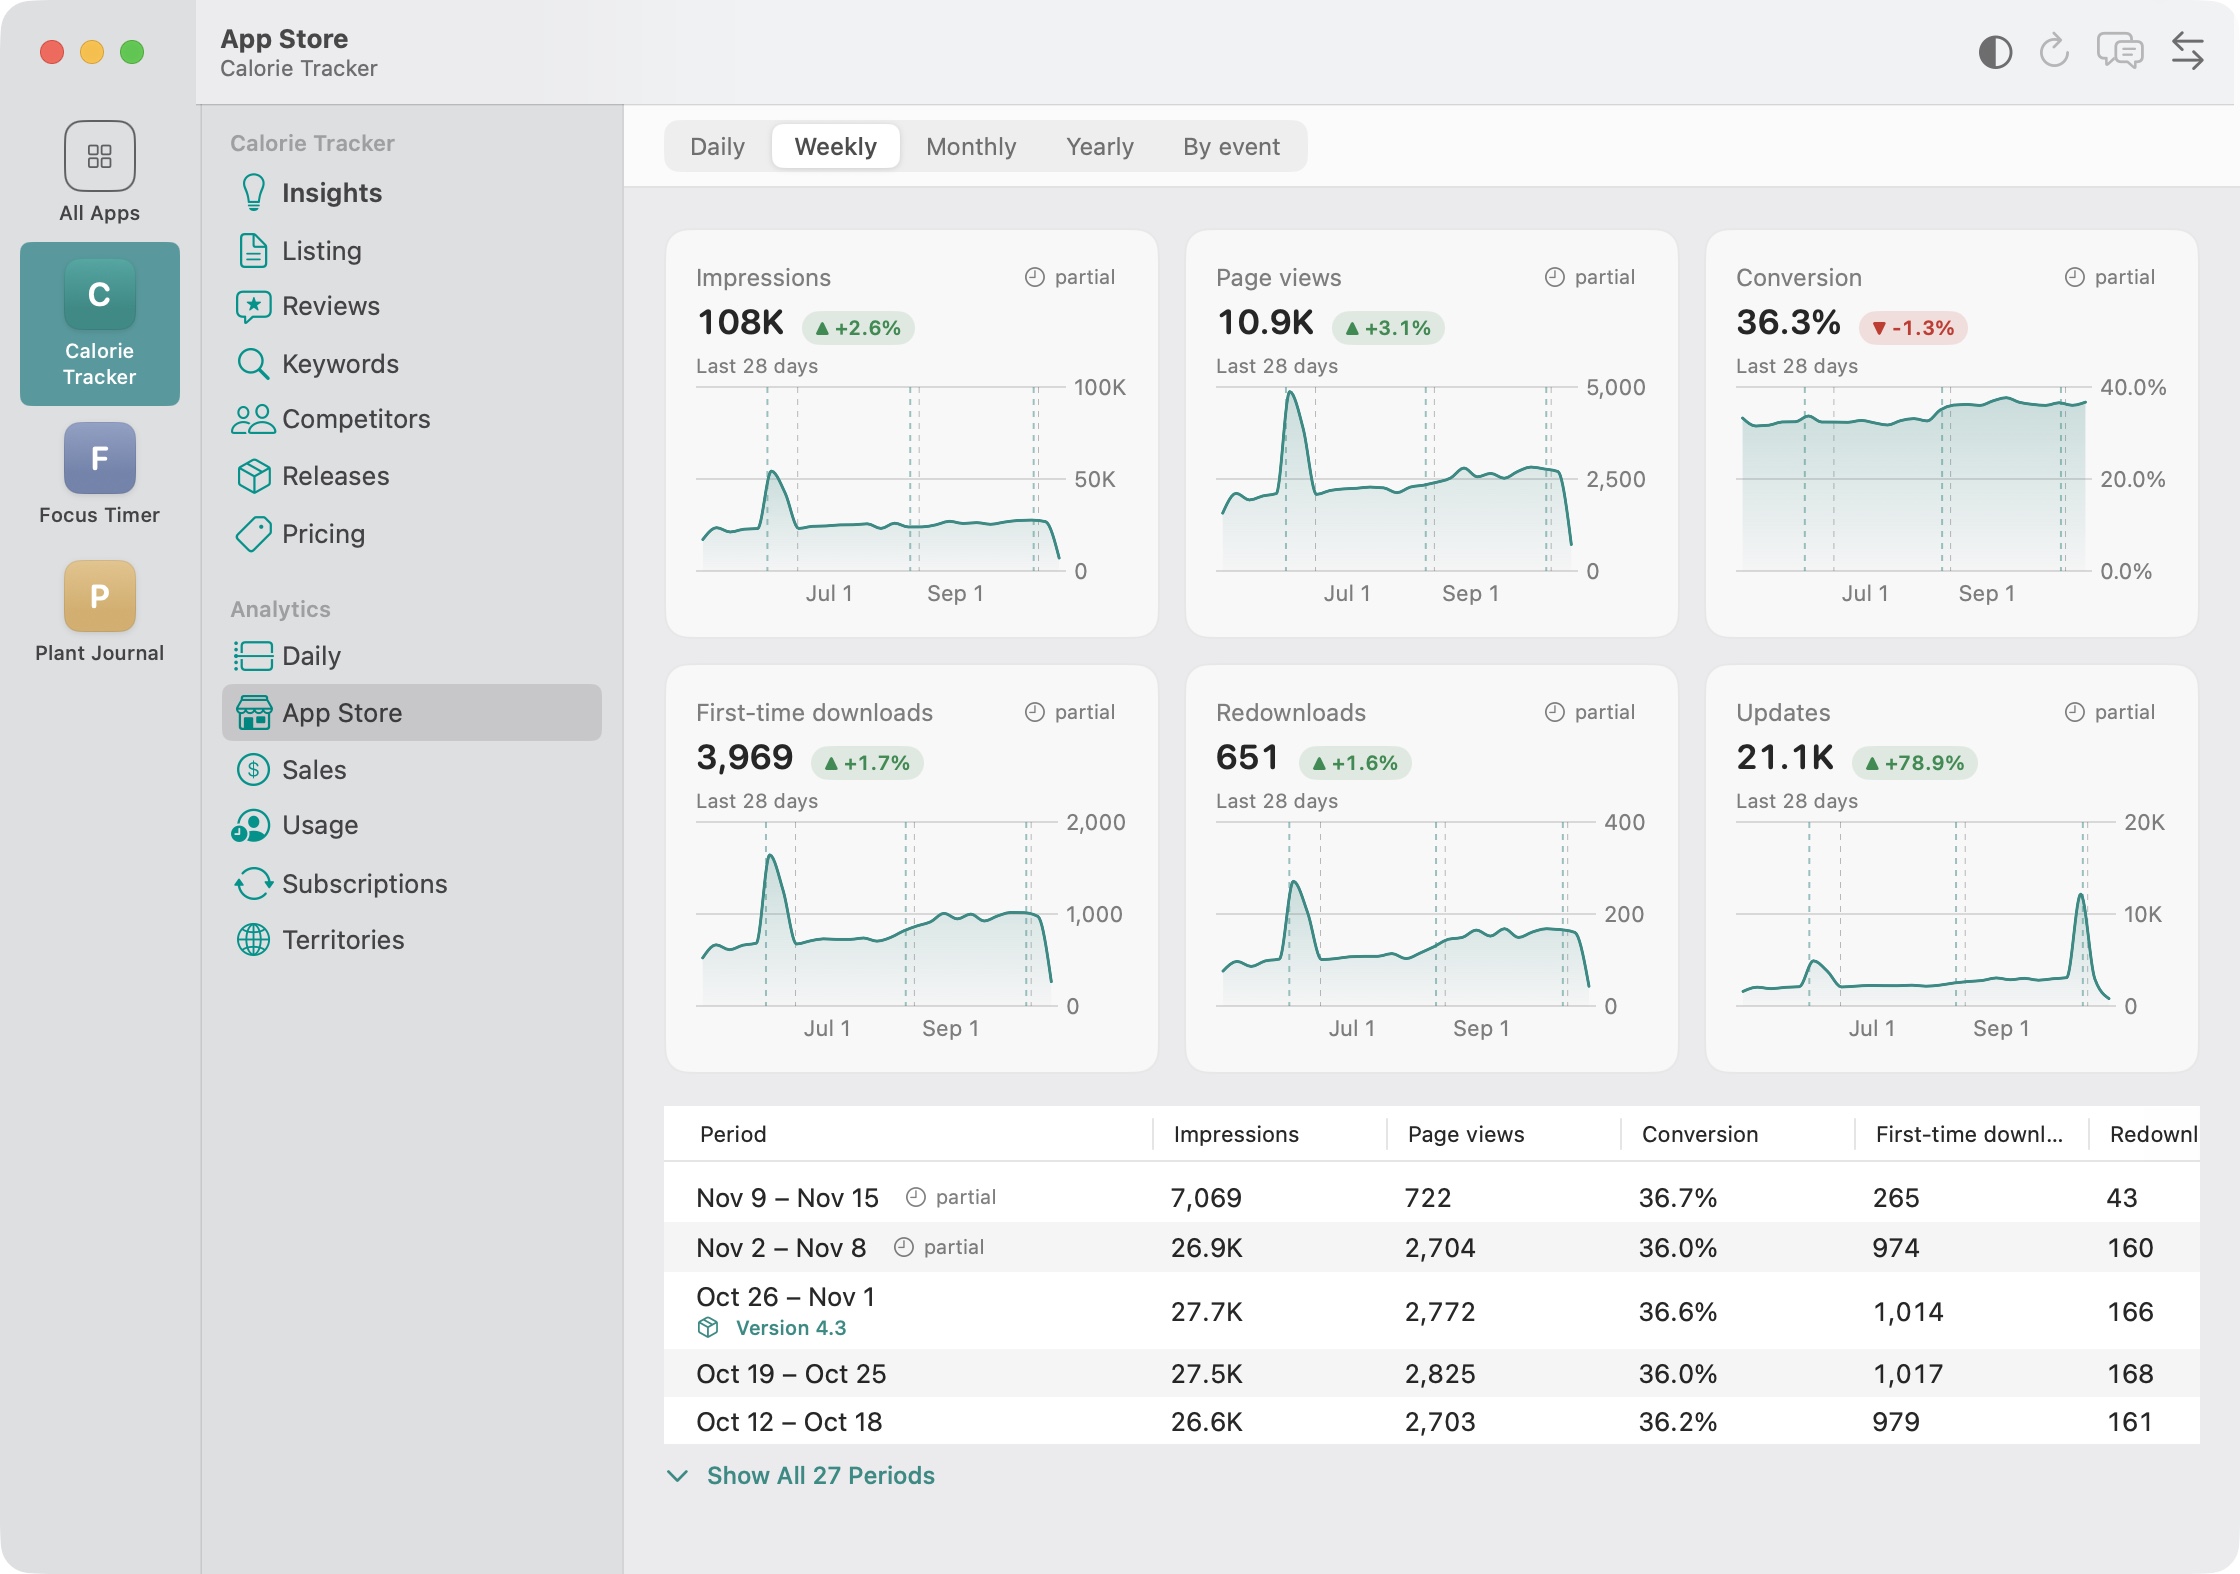
Apple's Analytics Reports API gives you the numbers behind App Analytics: impressions, product page views, first-time downloads by source, sessions, installs, deletions and crashes, per day, per country, for every app. It's the only official way to get that data out of App Store Connect automatically, and it's what Storewatch reads every day.
The API itself is small. What takes time is everything the docs mention in one sentence and you discover in your data a week later. This week I found one of those in my own app: a day that really had 27 first-time downloads showed 54. This guide walks through the whole flow, then the traps, starting with that one.
The short version
- An Admin creates a report request for each app, once:
ONGOINGfor new data every day, plus an optionalONE_TIME_SNAPSHOTfor history. - Wait 1 to 2 days for the first reports.
- List the request's reports, pick the ones you need (usually the Standard versions), and list each report's instances with daily granularity.
- Download each instance's segments: gzipped, tab-separated files.
- When an instance contains a day you already have, replace that day. Never add to it.
Before you start: keys and roles
You need an App Store Connect API key (Users and Access, Integrations) and a JSON Web Token signed with it: ES256, your key ID in the header, your issuer ID as iss, appstoreconnect-v1 as the audience, and an expiry no more than 20 minutes out.
Roles matter more here than in most of the API. According to Apple's guide to downloading analytics reports:
| Role | Create report requests | List and download reports |
|---|---|---|
| Admin | Yes | Yes |
| Sales and Reports | No | Yes |
| Finance | No | Yes |
In practice: create the requests once with an Admin key, then read them every day with a key that has less access. Apple suggests the Sales and Reports role if you share a key with a third party.
Step 1: Request the reports
Reports don't exist until you ask for them. Send one request per app:
POST /v1/analyticsReportRequests
{
  "data": {
    "type": "analyticsReportRequests",
    "attributes": { "accessType": "ONGOING" },
    "relationships": {
      "app": { "data": { "type": "apps", "id": "1234567890" } }
    }
  }
}
There are two access types:
ONGOING: generates reports every day from now on (and weekly and monthly ones). This is the one you want to keep running.ONE_TIME_SNAPSHOT: goes back as far as data is available, which for most reports is January 1, 2024, and then stops. It's for filling in history once.
Apple says the first reports take 1 to 2 days. To see what you've already requested, read GET /v1/apps/{id}/analyticsReportRequests. Do that before creating anything, so you don't pile up duplicate requests.
stoppedDueToInactivity. It won't restart on its own; you have to create a new request. Check the flag every time you list requests.Step 2: Find the reports you need
One request produces many reports. List them by category:
GET /v1/analyticsReportRequests/{requestId}/reports?filter[category]=APP_STORE_ENGAGEMENT
The categories are APP_STORE_ENGAGEMENT, COMMERCE, APP_USAGE, FRAMEWORK_USAGE and PERFORMANCE. Each report has a name like “App Store Discovery and Engagement Standard”. For a typical store dashboard, these are the ones that matter:
| Report | What it gives you | Complete after | Who's counted |
|---|---|---|---|
| App Store Discovery and Engagement | Impressions, product page views, taps | 3 days | Everyone |
| App Downloads | First-time downloads, redownloads, updates, restores, by source | 2 days | Everyone |
| App Store Installation and Deletion | Installs and deletions | 5 days | Opted-in users only |
| App Sessions | Sessions, total duration, unique devices | 5 days | Opted-in users only |
| App Crashes | Crashes by app version and device | 5 days | Opted-in users only |
The completeness times come from each report's page in Apple's Analytics Reports documentation.
Standard or Detailed? Many reports come in both. Standard leaves out fields that could identify people. Detailed has every field, but Apple adds a little random noise to each row (usually within ±2) and drops rows with fewer than 5 users or devices, as its privacy article explains. Sum a thousand noisy rows and the noise adds up, so use Standard for totals. I only read the detailed downloads report for one column it alone has: Source Info, the name of the referring app or website.
Step 3: List instances
An instance is one delivery of a report. List them with the granularity you want:
GET /v1/analyticsReports/{reportId}/instances?filter[granularity]=DAILY
Each instance has a processingDate: the day Apple processed it, not the day the data is about. Hold on to that distinction, because trap 1 depends on it.
Step 4: Download segments
GET /v1/analyticsReportInstances/{instanceId}/segments
Each segment has a url, a checksum and a sizeInBytes. The URL is pre-signed, so download it without your token. Files are gzip-compressed, tab-separated text with a header row. Large instances are split into several segments; read them all before you save the day.
A few habits that save trouble:
- Read columns by name. Apple adds columns over time (Campaign appeared in November 2024), so column positions aren't stable.
- Filter by App Apple Identifier. Don't assume every row is for the app you asked about.
- Remember which instances you've processed. Store the instance ID once it's saved, so a crash halfway through doesn't lead to reading it twice.
- Retry 429 and 5xx responses with backoff. Listing instances for several apps and reports is a lot of requests.
Trap 1: Later instances restate earlier days
This is the one that got me. The obvious way to store reports is to add each instance's rows to your totals: new instance, new numbers, add them up. It works for a few days, then your numbers slowly drift to about double.
Apple's guide says it in one line: an instance with a given processingDate “might contain data for that day, full data for past dates, or both”. Each report page adds that instances can carry late-arriving events or, rarely, corrections. In my data, the instance processed on one day contained the latest day and full copies of the previous few days. Adding them meant each day was counted once when it first arrived, then again each time it came back.
That's how one of my apps showed 54 first-time downloads for a day that really had 27.
The fix is to treat days, not instances, as the unit:
- Process instances oldest
processingDatefirst. - For each instance, collect every day it contains, including days whose rows are all zero.
- Delete what you have stored for those days (for that app and that report's metrics), then insert the instance's rows.
-- for each instance, oldest first
DELETE FROM daily_metric
 WHERE app_id = ? AND metric IN (...this report's metrics...)
   AND day IN (...every day in this instance...);
INSERT INTO daily_metric ... -- the instance's rows
The newest delivery of a day wins, which is exactly what you want when Apple sends corrections. After switching to this and re-reading every instance, my analytics downloads came back in line with the Sales report.
Trap 2: The snapshot and the ongoing request overlap
If you create both an ONGOING and a ONE_TIME_SNAPSHOT request, the snapshot covers history up to the day you asked, and the ongoing request covers everything from around then. They can overlap around the day you made the requests, and any day in both gets counted twice.
The simplest rule: process the ongoing request first, note the earliest day it covers for each report, and ignore snapshot rows on or after that day. Replacing days (trap 1) also limits the damage, but only if the overlapping rows arrive as whole days.
Trap 3: A quiet day looks like a missing day
When an app has nothing to report on a day, Apple usually leaves it out of that day's report entirely. There's no row with a zero; there's no row at all. So “no data for Tuesday” can mean two very different things: nobody downloaded the app, or the report hasn't arrived.
What worked for me is to look across the account. If another app on the same account has Tuesday in the same report, the report for Tuesday arrived, and your app's Tuesday was really zero. If no app has it, the day is still missing. That one check turns a chart full of scary gaps into honest zeros.
Trap 4: Opt-in reports skip days on purpose
Installs, deletions, sessions and crashes only come from people who agreed to share analytics with developers. Apple's privacy rules say these reports aren't generated at all when fewer than 5 users have events for that day. For a small or brand-new app, that means whole days with no usage report, forever.
You can't tell those days apart from a missing report, and the trick from trap 3 doesn't apply: another app having the day says nothing about yours. So label them for what they probably are, “hidden for privacy (fewer than 5 users)”, and keep them out of any “your data is broken” warnings. I learned that one the hard way too: my own app flagged 16 “missing” days that were all privacy gaps from an app's first weeks.
Two more things follow from it: usage numbers are a sample, not a census, and comparing sessions to downloads gives you an opt-in rate as much as an engagement rate.
Trap 5: Yesterday isn't final yet
A day's numbers keep changing until the report's completeness window has passed: 2 days for downloads, 3 for discovery and engagement, 5 for usage reports. If you compare “last 7 days” to “the 7 before”, the recent week is still filling in and will look worse than it is.
Two fixes, and I use both: mark recent days as partial in charts, and compare equal numbers of reported days rather than calendar days.
Trap 6: It won't match the Sales report exactly
Even with everything above right, first-time downloads from the analytics reports and units from the Sales and Trends report won't always agree. They're different pipelines, with different day boundaries and different rules for what counts. I covered the reasons, and how to reconcile them, in Why App Store Connect downloads don't match your Sales report. A useful habit: use the Sales report for the last day or two, while analytics is still incomplete, and switch to analytics once a day is final.
A checklist for your own sync
- Create
ONGOINGrequests with an Admin key, once per app; read them with a Sales and Reports key. - List existing requests before creating new ones, and recreate any that stopped due to inactivity.
- Use Standard reports for totals; Detailed only for fields you can't get elsewhere.
- Process instances oldest first, and replace whole days instead of adding.
- Cut snapshot history where ongoing data begins.
- Tell quiet days from missing days by looking across the account.
- Label opt-in gaps as privacy gaps, not errors.
- Mark days inside the completeness window as partial.
Frequently asked questions
How long does the first Analytics Reports API report take?
Apple says the first reports for a new request take 1 to 2 days. After that, ONGOING requests produce new daily instances every day.
Which role do I need for the Analytics Reports API?
Creating report requests needs an Admin key. Listing and downloading reports works with Admin, Sales and Reports or Finance.
How far back does the Analytics Reports API go?
For the main App Store reports, a ONE_TIME_SNAPSHOT request returns data from January 1, 2024 onwards.
Why are my Analytics Reports API numbers about double what App Store Connect shows?
Almost always because later instances repeat earlier days and you're adding them up. Replace each day with the newest instance that contains it, then re-read all instances.
Why are some days missing from the sessions or installs report?
Those reports only include people who share analytics with developers, and Apple doesn't generate them for a day with fewer than 5 such users. Small apps see these gaps often, and they don't fill in later.
Should I use the Standard or Detailed reports?
Standard for totals. Detailed reports add small random noise to every row and drop rows with fewer than 5 users, so summing them is less accurate. Use Detailed only for fields Standard doesn't have, like the referring app or website.
Or let Storewatch handle it
I built all of this into Storewatch so I'd never think about instances again. You add your App Store Connect key once; it requests the reports, reads every instance with the replace-the-day logic, fills in history, marks partial days and privacy gaps, and keeps everything on your Mac. If you'd rather build your own, I hope the traps above save you the week they cost me.