App Store analytics for your own apps: what Apple shows and what it doesn't
What App Store Connect Analytics, Sales and Trends and the Analytics Reports API show for iOS apps, their limits and delays, and when a separate analytics tool helps.
 By Alexander, maker of Storewatch · · 5 min read
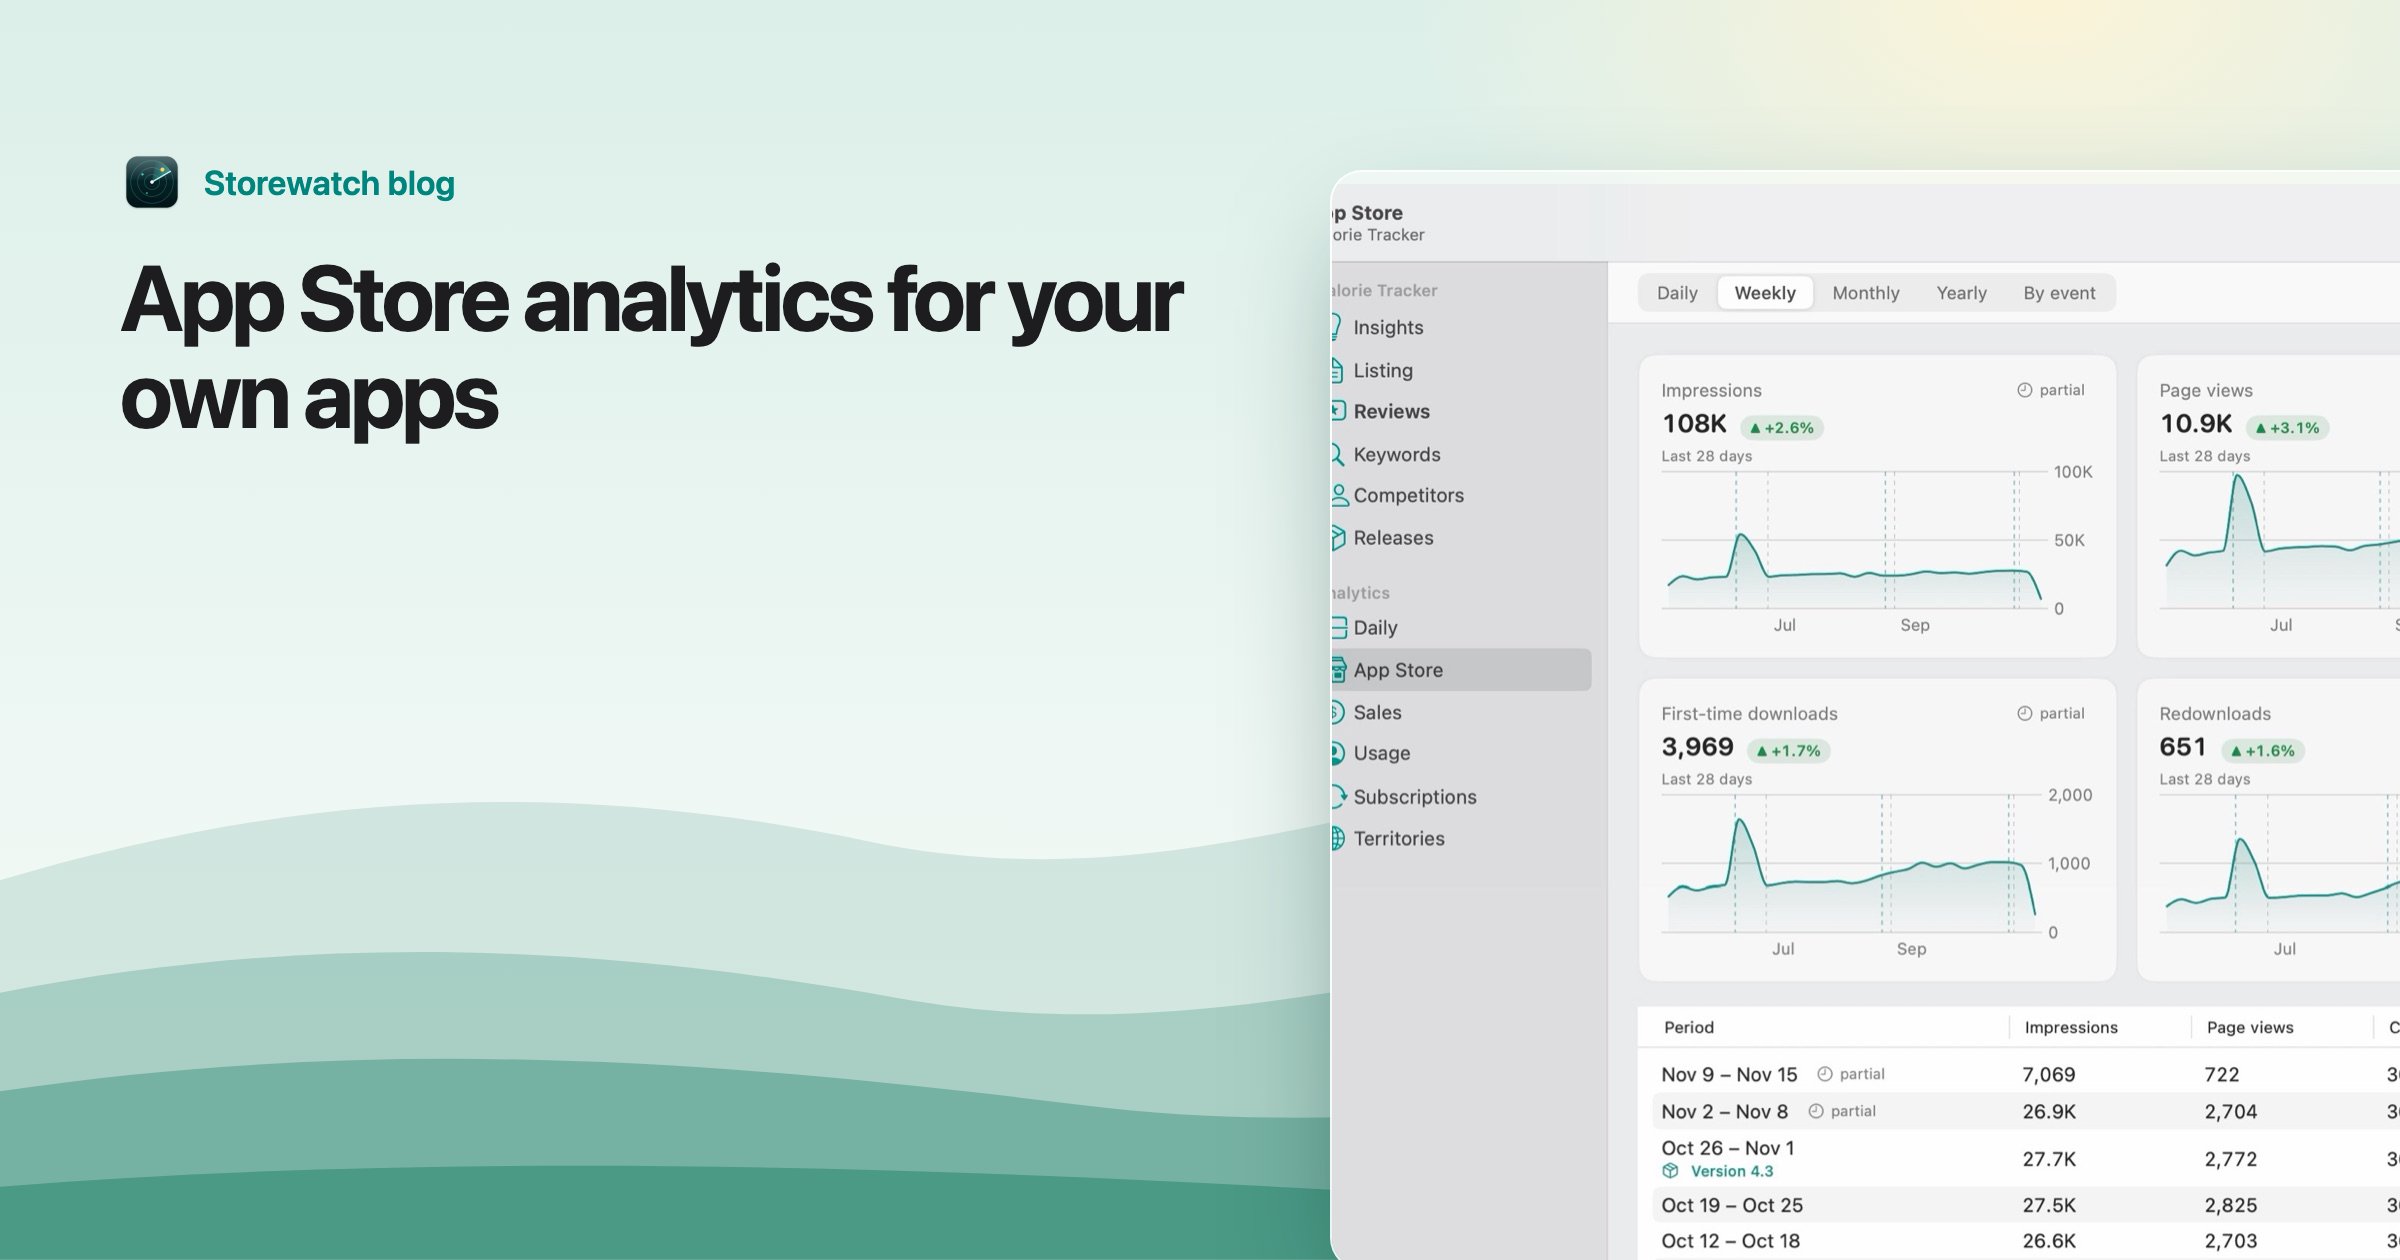
App Store analytics for your own app comes from three places, all part of App Store Connect: App Store Connect Analytics (how people find, download and use your app), Sales and Trends (units and proceeds, next day) and the Analytics Reports API (the same analytics as bulk files). For one app they are enough to answer most questions. They get awkward when you have several apps or accounts, want alerts, or need a long history in one place.
This guide covers what each tool shows, how current Apple's data is, which privacy rules hide numbers, and the options when you outgrow the dashboard. Everything about Apple's tools is from Apple's own documentation, as of November 2026.
What App Store Connect Analytics shows
Apple calls it the primary place to explore and understand your app's performance on the App Store. Its sections are Overview, Sources, Product Pages, In-App Events, Campaigns, Sales, Subscriptions, Cohorts, Offers, Retention, Benchmarks and Metrics. The Overview widgets include first-time downloads, redownloads, conversion rate, impressions, product page views, proceeds, paying users and monthly recurring revenue. The roles that can see it are Account Holder, Admin, Finance and Sales.
The metrics fall into groups, defined on Apple's metric definitions page:
- App Store: impressions, product page views, and conversion rate (total downloads and pre-orders divided by unique-device impressions). See what an impression is.
- Downloads: first-time downloads, redownloads and total downloads. The first-time downloads guide explains why they differ from units.
- Sales: in-app purchases, proceeds, sales, paying users and refunds.
- Usage: installations, sessions, active devices, crashes and deletions.
- Subscriptions: active plans, offers, renewals, churn, trial conversion and recurring revenue.
You can also compare against peer group benchmarks and break everything down by source, territory, device and more.
Sales and Trends, and the reports API
Sales and Trends records units, proceeds and sales when a customer starts a transaction, and Apple describes it as next-day data. It is the quickest read on yesterday's money. The money you are actually paid is in Payments and Financial Reports, a separate tool that follows Apple's fiscal calendar (see why your payment differs from proceeds).
The Analytics Reports API delivers App Store engagement, commerce and usage data as compressed tab-delimited files, for your own tools or spreadsheets. Our guide to the Analytics Reports API covers the setup. Apple's documentation says an Admin must request a report type the first time, and the first report of an ongoing request arrives about 24 to 48 hours later.
Data delays and privacy thresholds
Two rules explain most "why is this blank?" questions.
Delays
Per Apple's reports API documentation, data for a day is considered complete two days after the reporting date. So yesterday's analytics can still be partial, and the numbers can change when the day is finalized. Sales and Trends is next-day.
Privacy thresholds
Apple hides data when too few people are behind it:
| Metrics | Shown once there are |
|---|---|
| App Store and Downloads | At least five first-time downloads (App Store metrics also count pre-orders) |
| Usage | At least five active devices in the date range |
Usage numbers (sessions, active devices, crashes, deletions) only include people who agreed to share diagnostics and usage with developers, and watchOS isn't covered. The reports API additionally omits rows from fewer than five users or devices and adds small amounts of statistical noise. A new or small app will see gaps, and that is by design. The downloads vs Sales report guide shows how these differences add up.
What it doesn't do well
These are the limits a developer tends to run into, from my own use rather than a flaw in Apple's design. App Store Connect is made to explain one app on Apple's terms.
- Several apps at once. The dashboard answers questions app by app. To see how a whole portfolio did yesterday, I ended up opening each app in turn or exporting data.
- Several accounts. If you manage apps for clients, each developer account is its own login and its own payment. There is no combined view. (Tracking analytics for multiple apps covers options.)
- History and your own events. It's hard to line up a price change, a new screenshot or a release with the numbers around it, unless you keep your own log.
- Alerts. I don't know of a built-in alert for "downloads dropped" or "a competitor changed", so you find out when you look.
- Gaps and lag. The privacy thresholds and the two-day completion window mean small apps see holes, and yesterday is rarely final.
Third-party options
There are two kinds of tool, and they answer different questions.
| SDK-based analytics | App Store Connect-based tools | |
|---|---|---|
| Data comes from | Code you add to the app | Apple's reports, through an API key |
| Shows | What users do inside the app | Impressions, downloads, sales, reviews, subscriptions |
| Needs | A release, plus a privacy disclosure update | An API key, no code change |
They are complementary. In-app events tell you whether people finish onboarding; App Store Connect data tells you whether they ever found the app. If you only want the App Store side across many apps, the API-key kind needs no changes to your app. Check each tool's own docs for what it stores and where. See also best ASO tools if your question is keywords and ranks.
Where Storewatch fits
Storewatch is our Mac app, built for the gaps above. It reads App Store Connect with your own API key, which stays in your Mac's Keychain, and keeps its database on your Mac with no Storewatch servers. It shows downloads, proceeds, impressions, page views, conversion, sessions, crash rate and active subscriptions for all your apps on one dashboard, with yesterday in one sentence, day-by-day downloads by country, Territories, subscriptions, reviews with replies, and AdMob earnings next to your proceeds. Several developer accounts can be added, each with its own next payout. You can log events like price changes and see them on charts, and alerts and Insights flag what changed. It costs $29 once (early-bird; $39 from December), with a 3-day free trial.
It reads what Apple reports, so Apple's privacy thresholds and delays still apply, and it has no data on other companies' apps. It is for macOS only.
Frequently asked questions
Is App Store Connect Analytics free?
It is part of App Store Connect, available to your developer account. Apple's documentation describes no separate fee for it.
Who can see App Store Connect Analytics?
Per Apple, the Account Holder and people with the Admin, Finance or Sales role.
How long does it take for App Store data to appear?
Sales and Trends is next-day. For the Analytics Reports API, Apple says a day's data is complete two days after the reporting date, and the first report from a new ongoing request takes about 24 to 48 hours.
Why is my analytics data missing?
Usually a privacy threshold. App Store and Downloads metrics need at least five first-time downloads; usage metrics need five active devices in the date range and only count users who share diagnostics with developers.
Does App Store Connect show analytics for Android?
No. It covers Apple's platforms: iOS, macOS, tvOS and visionOS. Usage data doesn't include watchOS.
Can I get my analytics outside App Store Connect?
Yes. The Analytics Reports API exports the data as files, and tools that use an App Store Connect API key read the same reports for you.