App impressions: what App Store impressions, page views and conversion mean
What app impressions are in App Store Connect, how they differ from unique devices and product page views, and how conversion rate is calculated.
 By Alexander, maker of Storewatch · · 6 min read
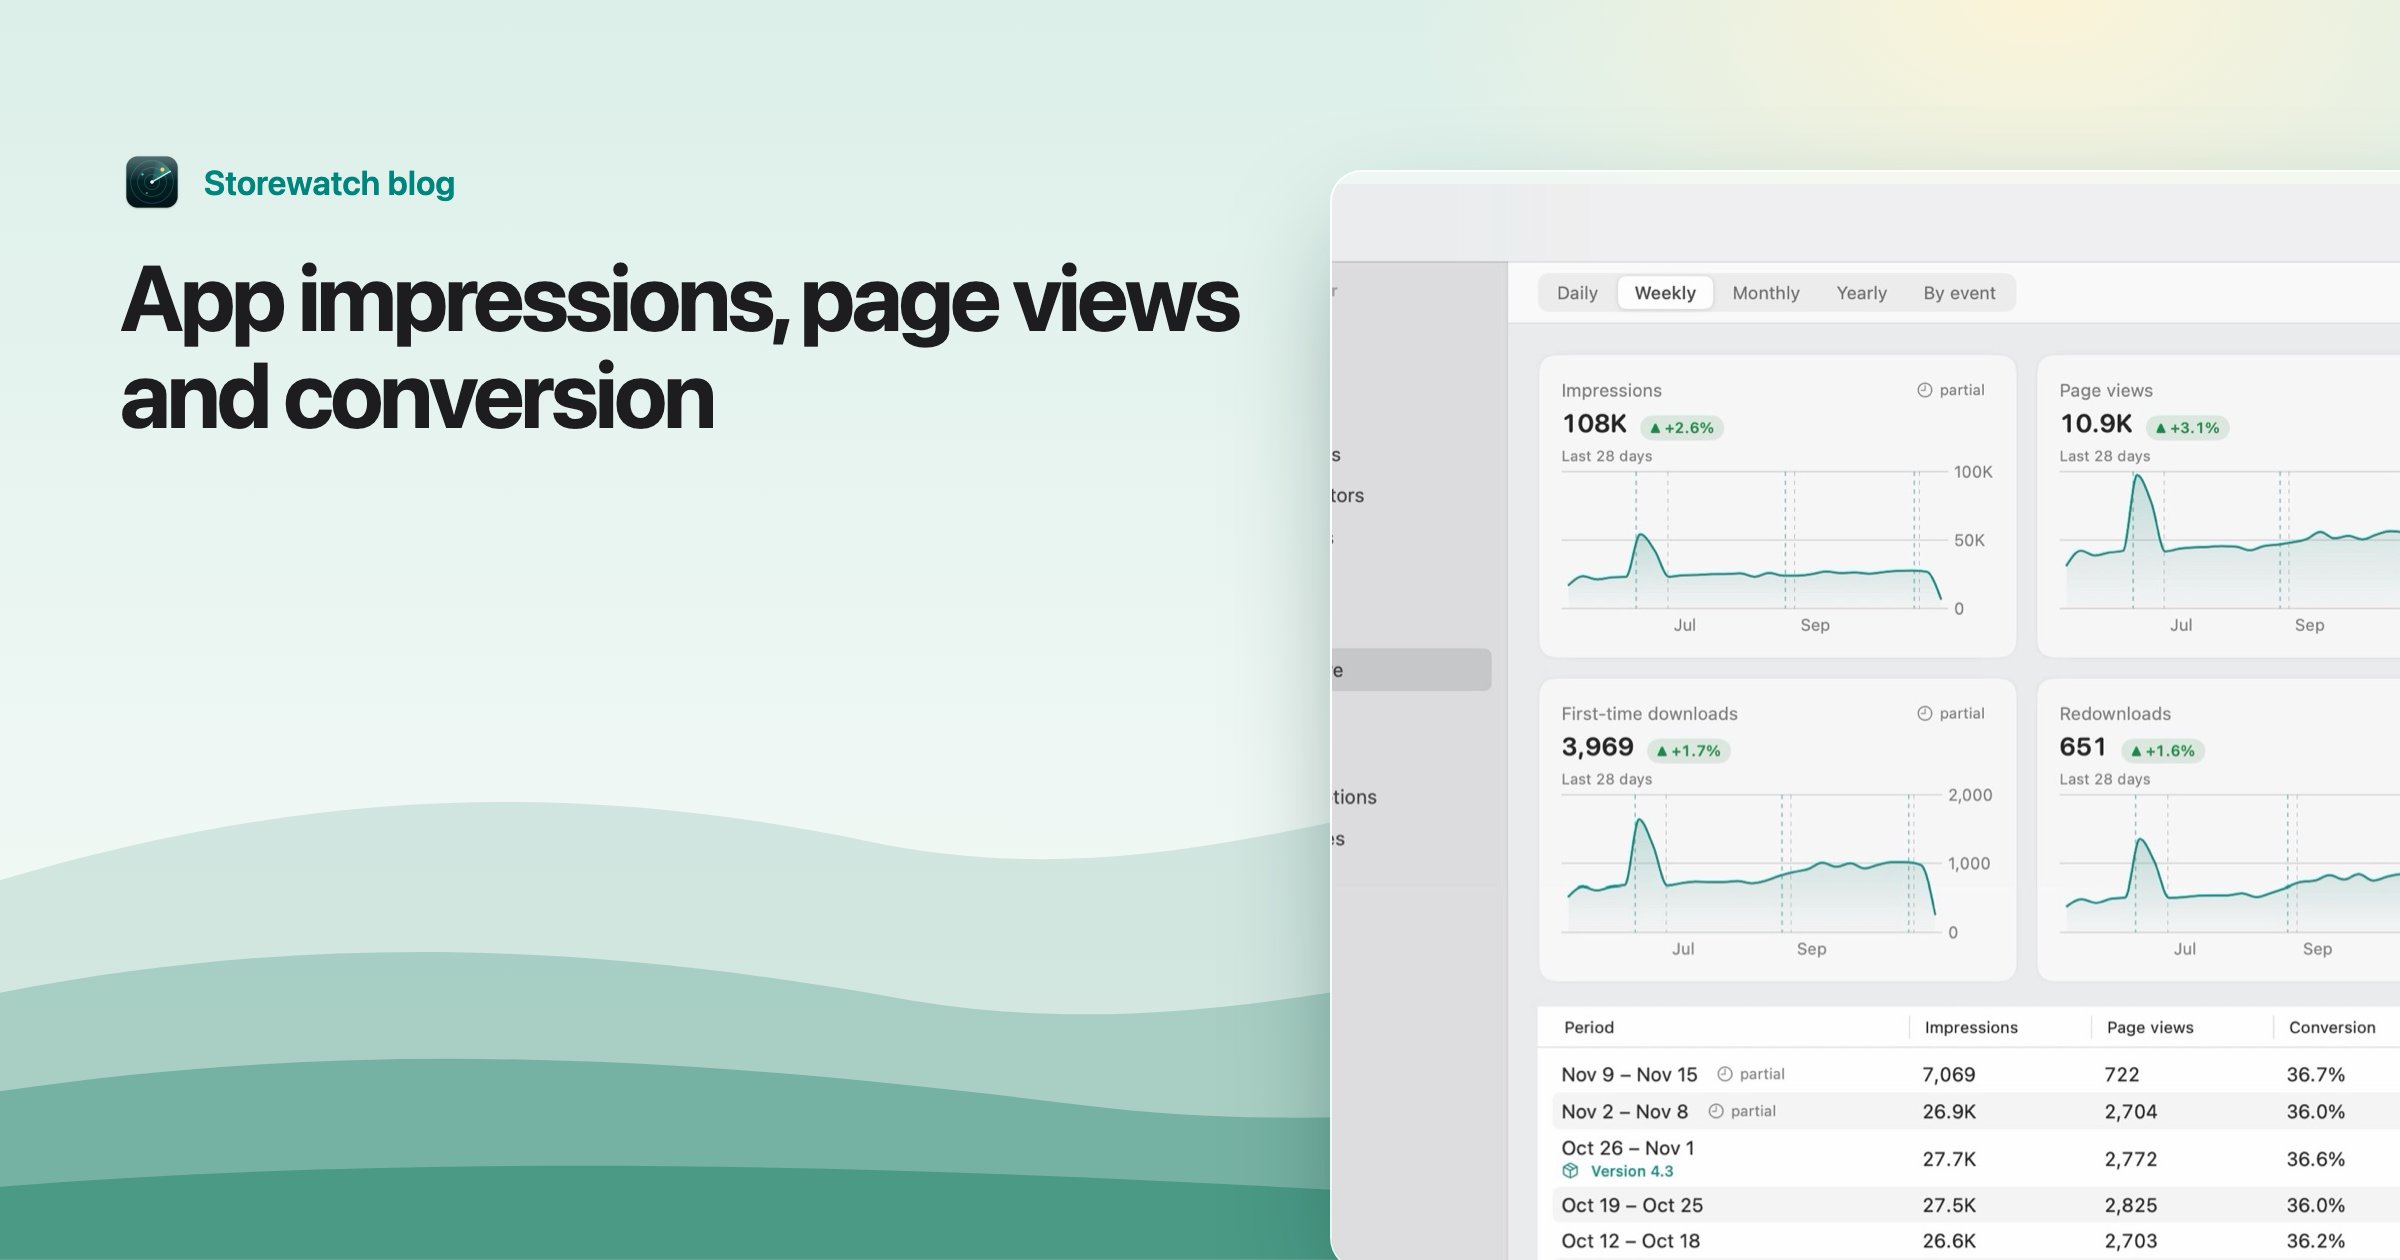
App impressions (App Store impressions) are the number of times your app was shown to people in the App Store, counted when it was on screen for more than one second. They are the top of the App Store funnel: impressions lead to product page views, and product page views lead to downloads.
This page explains each step of that funnel as App Store Connect reports it, how conversion rate is calculated, what moves each number, and a worked example. Definitions are as of November 2026.
The four metrics
These come from Apple's app metrics reference.
| Metric | Apple's definition, in short |
|---|---|
| Impressions | The number of times your app was viewed on the Today, Games, Apps and Search tabs of the App Store for more than one second. Includes product page views. |
| Impressions (Unique Devices) | The number of unique devices that viewed your app on those tabs. Includes unique product page views. |
| Product Page Views | The total number of times your App Store product page was viewed. Includes when apps use StoreKit to load your product page. |
| Conversion Rate | Total downloads and pre-orders divided by unique device impressions. |
Apple shows these App Store metrics once your app has at least five first-time downloads or pre-orders.
Impressions versus impressions (unique devices)
Plain impressions count every view. If one person scrolls past your app in search results three times in a day, that is three impressions. Impressions (Unique Devices) counts that device once.
The unique figure is the better denominator for conversion, because one device can only download your app so many times. It is also the one to watch for reach: how many different devices saw you. The plain figure is useful for volume and for spotting repeated exposure.
Where impressions happen
Apple counts impressions on the Today, Games, Apps and Search tabs. In App Analytics you can split traffic by source type. The main source types are App Store Search, App Store Browse, App Referrer and Web Referrer. Apple's filters and dimensions page defines the last two: the app or website from which a customer tapped a link to your product page.
- App Store Search: people who found you through a search.
- App Store Browse: people who found you by browsing, for example Today, charts or category lists.
- App Referrer and Web Referrer: people who tapped a link in another app or on a website.
I could not find Apple help text that defines Search and Browse in detail, so treat those two one-line descriptions as a plain-language guide, not Apple's wording. Check the Source Type filter in your own App Analytics to see exactly what your app gets.
Product page views
A product page view is someone opening your app's page, from search results, a featured card, a link or a StoreKit sheet. It is a stronger signal than an impression, because the person chose to look. The ratio of page views to impressions tells you how well your icon, name and subtitle earn the tap. The ratio of downloads to page views tells you how well the page itself (screenshots, description, ratings) persuades.
How conversion rate is calculated
Apple's formula is (total downloads + pre-orders) divided by impressions (unique devices). The denominator is unique-device impressions, not page views. That makes it a funnel-wide number, from "saw your app" to "downloaded it".
Two consequences. A person can download straight from search results without opening your page, so conversion does not simply track page views. And because it is based on unique devices, repeated impressions on one phone do not drag it down.
Apple's help page does not say whether "total downloads" inside the formula already contains pre-orders, so I would not try to rebuild the exact figure by hand from rounded chart numbers.
Storewatch note: Storewatch uses Apple's definition: total downloads (first-time downloads plus redownloads) divided by unique-device impressions. Pre-orders aren't in Apple's Analytics Reports, so for an app taking pre-orders the rate can be slightly lower than the one App Store Connect shows.
What moves impressions
- Keyword rankings. Higher ranks for searched keywords put you in front of more searchers. See how the 100-character keyword field works and why public rank checks differ from what users see.
- Featuring and Today stories. Being featured raises Browse impressions sharply for a short time.
- Apple Ads. Paid placements add impressions in search results. I could not confirm from Apple's help pages how these are split from organic search in App Analytics, so watch how your own Search numbers move when a campaign starts or stops.
- Seasonality and category rank. Charts and category lists change daily.
What moves conversion
- Icon and name. They decide whether an impression becomes a tap.
- Screenshots, preview video and description. They decide whether a page view becomes a download.
- Ratings and reviews. Visible on search results and on the page.
- Price and relevance. A mismatch between the keyword someone searched and your app shows up as a low conversion rate.
Change one thing at a time and give it a couple of weeks, because impressions and downloads both move with the season.
A worked example
Example only: these numbers are made up to show the arithmetic. They are not benchmarks.
| Metric | Value |
|---|---|
| Impressions | 20,000 |
| Impressions (unique devices) | 8,000 |
| Product page views | 1,200 |
| Total downloads | 200 |
Conversion is 200 divided by 8,000, which is 2.5%. On average each device saw your app 2.5 times (20,000 divided by 8,000). Now suppose a new icon lifts the same impressions to 1,800 page views and 280 downloads. Conversion becomes 280 divided by 8,000, or 3.5%, with no change in reach. If instead a new keyword rank doubled unique impressions to 16,000 but downloads only rose to 280, conversion would fall to 1.75%: more people saw you, but fewer in proportion acted. Neither is bad on its own; they point to different fixes.
How Storewatch shows them
Storewatch reads Apple's analytics reports with your own App Store Connect API key and keeps the data on your Mac. On the analytics screens, each app shows impressions, product page views, conversion and downloads over time, with the newest days marked partial until Apple's data settles. The all-apps dashboard shows the same figures for every app with change against the previous period or last year, and the ASO Markets view breaks impressions and downloads down by country. The analytics reports API guide covers where these numbers come from. For download definitions, see first-time downloads vs redownloads.
Frequently asked questions
What are app impressions?
The number of times your app was viewed on the Today, Games, Apps and Search tabs of the App Store for more than one second, as defined by Apple in App Store Connect.
What is the difference between impressions and unique devices?
Impressions count every view. Impressions (Unique Devices) counts each device once. Conversion rate uses the unique figure.
Are impressions the same as product page views?
No. Impressions are views of your app in lists and results; a product page view is someone opening your page. Apple's impression totals include product page views.
How is App Store conversion rate calculated?
Total downloads and pre-orders divided by impressions (unique devices), per Apple's app metrics reference.
Why are my impressions missing?
Apple shows App Store metrics only once an app has at least five first-time downloads or pre-orders. New or very small apps may see blanks.
What is a good conversion rate?
Apple does not publish a benchmark, and it varies by category and traffic source. Compare your own rate over time, and against your own changes, rather than against a number from a blog.